During the last two weeks, Stellar XLM gained over 35% and is one of the top crypto gainers in June. However, based on our technical analysis, we believe the token has the potential for another 15% upswing. This article will explain why this is the case and how a potential trade setup can look.
Stellar’s Current Orbit: The XLM Market Overview
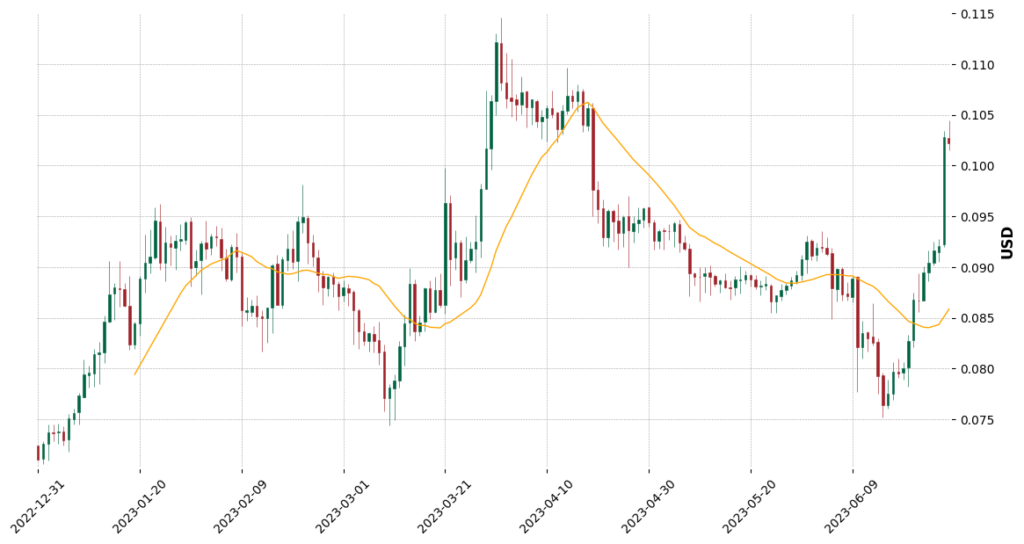
Stellar Lumens (XLM) is showing promising signs in the crypto market. The token is currently trading at $0.103, marking a modest gain of 0.34% over the last 24 hours. However, the underlying market dynamics seem to suggest a potential bullish movement in the foreseeable future.
The key feature in XLM’s current landscape is its gradual approach toward the resistance level of 0.1166. This pattern is still evolving and, if successful, could steer the token toward a nearly 15% price increase. This would mark a significant uptick from the token’s current trading range. Nonetheless, the timing of this event is hard to pin down and may unfold over the next days or more.
XLMS’ Technical Indicators
To understand XLM’s trajectory, it is crucial to examine the various technical indicators that govern its movement.
Firstly, the trend based on the moving average signals a Short Term, Medium Term, and Long Term Uptrend. Based on the recent surge, XLM broke through all moving averages and traded well above them. Since we all know that “the trend is your friend,” this signals a bullish movement.
On the other hand, the Relative Strength Index (RSI) for XLM is currently overbought — which is not surprising when looking at the recent run and 35% surge.
Interestingly, the Moving Average Convergence Divergence (MACD), a crucial momentum indicator, shows a bullish outlook for XLM. This implies that the momentum could shift towards the bulls, marking a potential reversal of the prevailing downtrend.
Adding to this bullish sentiment is the Ultimate Oscillator indicator, which also signals a bullish phase. Oscillators help identify overbought or oversold conditions, and a bullish signal could indicate an upcoming rally.
Lastly, the Average Directional Index (ADX) for XLM is strong. The ADX measures the strength of a trend, and a strong ADX suggests that the current trend, whether bearish or bullish, could persist.
XLM’s Trade Setup & Outlook
Since the technical indicators (except for the RSI) show strong bullish signs, we do expect a continuation of XLM’s current trend. The primary determinant of this outcome would be how XLM interacts with the resistance level of 0.1166. A successful test of this level could unlock the 15% gain, although the path may see several fluctuations along the way.
However, the overbought RSI holds a huge potential for a short-term retracement. Therefore, a potential trade setup can include opening a long position at $0.095.
About Stellar (XLM)
Stellar Lumens (XLM) is the native cryptocurrency of the Stellar network, a platform designed to enable fast, low-cost international transactions. It serves as a bridge currency for cross-border transfers and aims to promote financial inclusion globally.