Navigating the volatile world of cryptocurrency trading can be both exhilarating and overwhelming, particularly for those new to the game. Identifying the optimal crypto trading entry signs is crucial to maximize potential profits and minimize losses.
In this comprehensive guide, we will explore eight essential crypto trading entry signs that, when used in conjunction, can help traders make more informed decisions and improve their chances of success. Moreover, the guide will show you exactly how to use the signs in order to improve your trading skills.
So let’s get right into it and discuss eight of the most essential crypto trading entry signs.
Crypto Trading Entry Signs #1 — Moving Averages
There are several types of moving averages. However, for this guide we focus on the Simple Moving Average (SMA) and the Exponential Moving Average (EMA).
Simple Moving Average (SMA)
The Simple Moving Average (SMA) is a widely-used technical indicator that calculates the average price of an asset over a specified period. By smoothing out price fluctuations, the SMA helps traders identify trends and potential entry points. To calculate the SMA, simply add the closing prices for the selected period (e.g., 10 days) and divide the sum by the number of days.
Exponential Moving Average (EMA)
The Exponential Moving Average (EMA) is another type of moving average that gives more weight to recent price data, making it more responsive to price changes. This responsiveness can be beneficial in the fast-moving crypto market, as it allows traders to identify trend reversals more quickly. The EMA calculation involves a more complex formula than the SMA but is readily available on most charting platforms.
Moving Averages — Crypto Trading Entry Signs
Now that we know what SMA and EMA is about, it’s time to discuss the perfect crypto trading entry sign strategy. Actually it’s one of the easiest strategies — called the Moving Average Crossover. The strategy basically signals a trend (reversal). So here’s how it works:
The Moving Average Crossover occurs when a shorter-term moving average (e.g., 10-day) crosses above or below a longer-term moving average (e.g., 50-day). When the shorter-term MA crosses above the longer-term MA, it signals a potential bullish entry point. Conversely, when the shorter-term MA crosses below the longer-term MA, it suggests a bearish entry opportunity.
Crypto Trading Entry Signs #2 — Relative Strength Index (RSI)
The Relative Strength Index (RSI) is a momentum oscillator that measures the speed and change of price movements on a scale of 0 to 100. The RSI helps traders identify overbought and oversold conditions, which can signal potential entry points for trades.
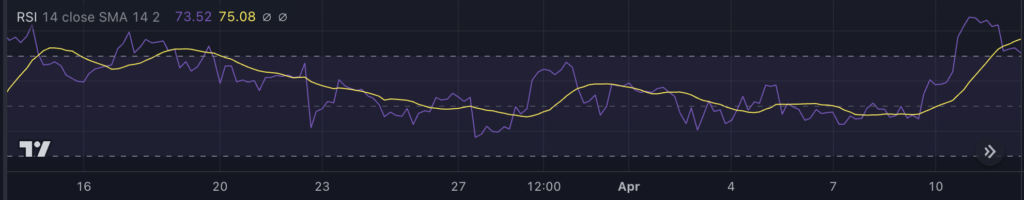
The usage of the RSI is pretty straightforward:
Sell (Short) Signal
An RSI value above 70 typically indicates overbought conditions. Consequently, an RSI above 70 reflects a potential selling opportunity.
Buy (Long) Signal
Conversely, an RSI value below 30 often signals oversold conditions, indicating a potential buying opportunity.
Both values are not set into stone and you can adjust them. For example many traders, go for more extreme values, such as 80 for and overbought territory and 20 for oversold.
Crypto Trading Entry Signs #3 — Support and Resistance Levels
Alright, now it gets slightly more tricky. Let’s discuss our third crypto trading entry sign: The support and resistance levels.
aIdentifying Support and Resistance Levels
Support and resistance levels are critical components of technical analysis, representing price points where buying or selling pressure is strong enough to prevent further price movement in a particular direction. Support levels act as a floor for prices, where buying pressure tends to be strong enough to prevent further declines. Resistance levels, on the other hand, act as a ceiling, where selling pressure is strong enough to prevent further increases. These levels can be identified by analyzing historical price action and looking for areas where prices have consistently rebounded or reversed.
Trading Strategies Using Support and Resistance
Traders often enter long positions near support levels and short positions near resistance levels, anticipating price reversals. When a price breaks through a support or resistance level, traders may choose to enter a position in the direction of the breakout, expecting the price to continue in that direction. Using support and resistance levels in conjunction with other technical indicators can help traders refine their entry signals and increase the likelihood of successful trades.
🚀 Want to get started with crypto trading? Sign up to Binance and earn 5% commission on your trades! 🚀
Crypto Trading Entry Signs #4 — Fibonacci Retracement
Simply explained, Fibonacci levels predict potential reversal points. Therefore, you can use them a crypto trading entry sign and place your order in the area of fibonacci levels. Here are some more details:
The Fibonacci Sequence
Fibonacci retracement levels are derived from the Fibonacci sequence, a mathematical concept discovered by the 13th-century Italian mathematician Leonardo Fibonacci. The sequence is a series of numbers in which each number is the sum of the two preceding ones (e.g., 0, 1, 1, 2, 3, 5, 8, 13, 21…). When these numbers are divided by the previous number in the sequence, they approach the golden ratio of 1.618.
Applying Fibonacci Retracement in Crypto Trading
Traders use Fibonacci retracement levels to predict potential reversal points in a trending market. By drawing lines between a significant high and low, traders can identify levels where the market may retrace before continuing its original trend. Common Fibonacci retracement levels include 23.6%, 38.2%, 50%, 61.8%, and 78.6%. These levels can serve as potential entry points for long or short positions, depending on the direction of the primary trend.
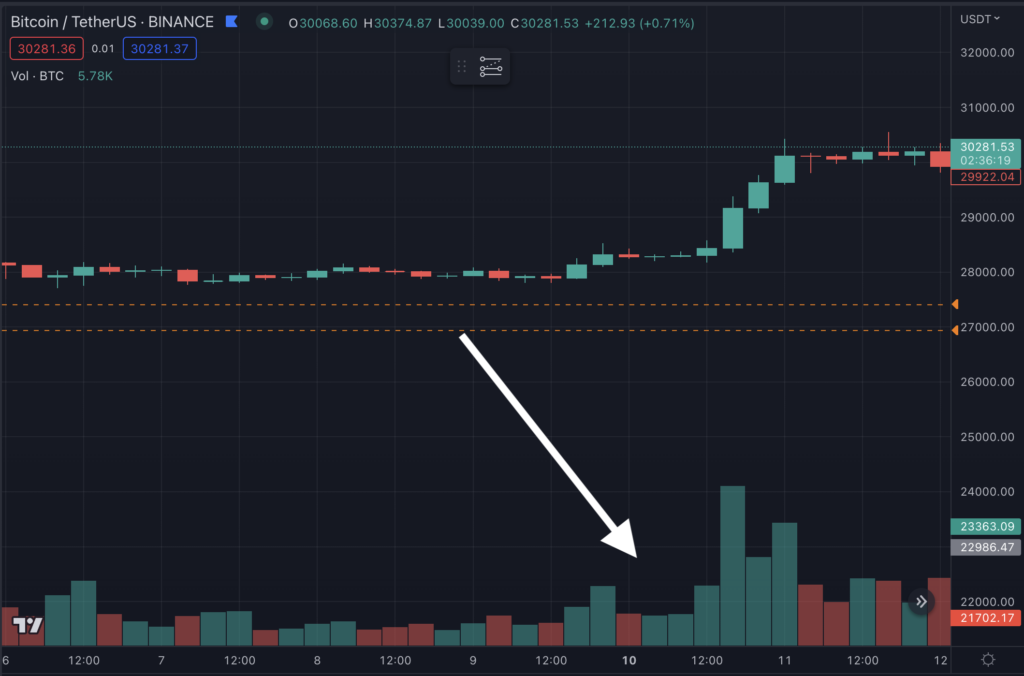
Crypto Trading Entry Signs #5 — Breakouts
Breakouts can be a brilliant crypto trading entry sign. Moreover, when used correctly (and patiently) it can help to gain massive earnings. Let’s look at the details:
Identifying Breakouts
A breakout occurs when an asset’s price moves above a resistance level or below a support level, often accompanied by a surge in trading volume. Breakouts can signal the beginning of a new trend, providing traders with an opportunity to capitalize on price momentum.
Trading Breakouts Effectively
To trade breakouts effectively, traders must first identify significant support and resistance levels. When a price breaks through one of these levels, traders can enter a position in the direction of the breakout, placing a stop-loss order below the broken support or above the broken resistance level to protect against potential reversals. It’s essential to wait for confirmation of the breakout, as false breakouts can occur and lead to losses. Using other technical indicators, such as RSI or MACD, can help confirm the validity of a breakout.
Crypto Trading Entry Signs #6 — MACD (Moving Average Convergence Divergence)
The Moving Average Convergence Divergence (MACD) is a trend-following momentum indicator that compares two moving averages of an asset’s price. The MACD consists of three components: the MACD line, the signal line, and the histogram. The MACD line is calculated by subtracting the longer-term EMA (usually 26-day) from the shorter-term EMA (typically 12-day), while the signal line is the 9-day EMA of the MACD line. The histogram represents the difference between the MACD line and the signal line.
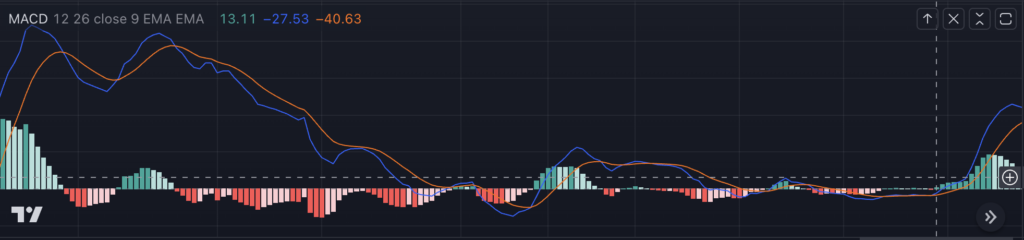
Interpreting MACD Signals
MACD signals can help traders identify potential entry points for trades. A bullish signal occurs when the MACD line crosses above the signal line, suggesting a potential buying opportunity. A bearish signal occurs when the MACD line crosses below the signal line, indicating a potential selling opportunity. Additionally, when the MACD histogram moves from negative to positive territory, it can signal a bullish trend, while a shift from positive to negative territory can indicate a bearish trend. It’s essential to use MACD signals in conjunction with other technical indicators and trading strategies to improve the accuracy of entry points.
🚀 Want to get started with crypto trading? Sign up to Binance and earn 5% commission on your trades! 🚀
Crypto Trading Entry Signs #7 — Candlestick Patterns: Decoding the Language of Price Action
Candlestick patterns are visual representations of price movements that can provide valuable insights into potential market reversals. Several bullish candlestick patterns can signal buying opportunities:
Hammer
A hammer is a bullish reversal pattern characterized by a small body and a long lower wick. The pattern occurs at the end of a downtrend and suggests that buyers are beginning to gain control.
Inverted Hammer
The inverted hammer is similar to the hammer pattern but has a long upper wick instead of a lower wick. It also indicates a potential bullish reversal.
Morning Star
The morning star is a three-candle pattern that forms after a downtrend. It consists of a long bearish candle, a small-bodied candle, and a long bullish candle. This pattern signals a potential reversal to the upside.
Common Bearish Candlestick Patterns
Several bearish candlestick patterns can signal selling opportunities:
Bearish Engulfing
The bearish engulfing pattern occurs when a bearish candle engulfs the previous bullish candle, signaling a potential reversal to the downside.
Shooting Star
The shooting star is a bearish reversal pattern characterized by a small body and a long upper wick. The pattern occurs at the end of an uptrend and suggests that sellers are beginning to gain control.
Evening Star
The evening star is a three-candle pattern that forms after an uptrend. It consists of a long bullish candle, a small-bodied candle, and a long bearish candle. This pattern signals a potential reversal to the downside.
Recognizing these patterns in conjunction with other technical indicators can offer valuable entry signals for traders.
Crypto Trading Entry Signs #8 — Volume
Trading volume refers to the number of shares or contracts traded during a specific period. Analyzing trading volume can help identify potential entry points, as significant volume spikes can indicate strong buying or selling interest. High volume during a price breakout can provide confirmation that the breakout is valid and has a higher likelihood of continuing.
Using Volume in Conjunction with Other Indicators
Incorporating volume analysis into your trading strategy can help confirm entry signals generated by other technical indicators. For example, when a breakout occurs on high volume, it adds credibility to the signal, increasing the likelihood that the price will continue moving in the breakout’s direction. Similarly, a significant increase in trading volume accompanying a bullish or bearish candlestick pattern can provide further evidence of a potential reversal.
Crypto Trading Entry Signs — Conclusion
Identifying the optimal entry points for crypto trades is crucial for maximizing potential profits and minimizing losses.
By mastering these eight essential entry signs, traders can make more informed decisions and improve their chances of success in the fast-paced world of cryptocurrency trading. Remember that no single indicator or strategy guarantees success.
It’s vital to combine multiple indicators, strategies, and risk management techniques to enhance your trading performance. Additionally, staying informed about market news and developments is crucial, as fundamental factors can significantly impact cryptocurrency prices.
🚀 Want to get started with crypto trading? Sign up to Binance and earn 5% commission on your trades! 🚀