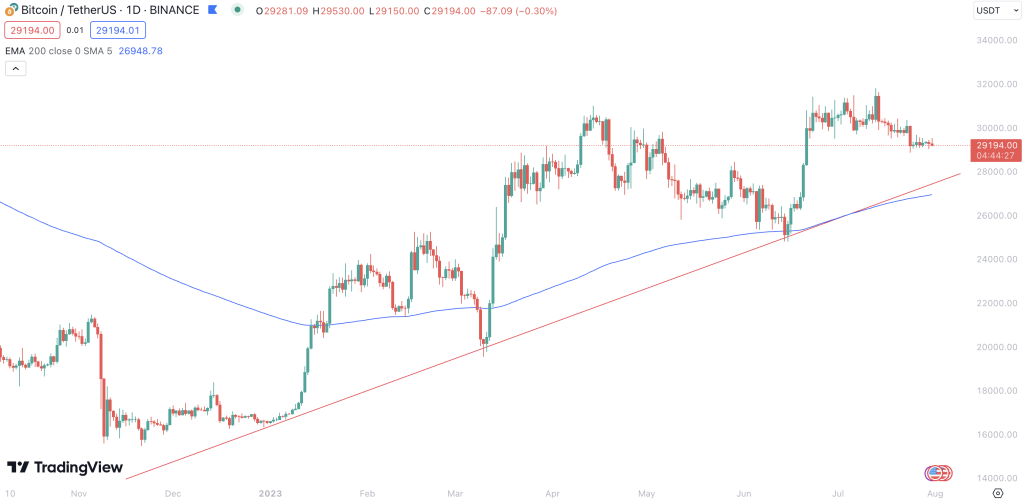
Bitcoin, the original and largest cryptocurrency, currently trades at $29,190. In the past 24 hours, the price has slightly dipped by 0.3%, representing an unsettling dynamic for Bitcoin enthusiasts. After a powerful rejection of $32,000, BTC has again descended beneath the psychologically critical $30,000 support level as traders rush to secure profits from a previous uptrend.
This considerable movement resulted from a breakout from a ‘Channel Down’ pattern, which saw Bitcoin rise and briefly grace the $32,000 mark. Yet the high proved short-lived and the price was soon in retreat, now potentially pulling back to a $28,000 support level. This could provide an enticing swing entry in the market.
Bitcoin’s Technical Indicators
In the world of cryptocurrency, few things are as vital as technical indicators. For Bitcoin, these indicators present a complex but telling picture.
Starting with the trends based on moving averages, Bitcoin is experiencing a short-term and medium-term downtrend, but the long-term view remains optimistic. The Relative Strength Index (RSI), which measures the speed and change of price movements, maintains a neutral position. This indicates a balance between the buying and selling pressures.
The Moving Average Convergence Divergence (MACD) is bearish. This technical trend-following momentum indicator suggests that the short-term momentum of Bitcoin is lower than its long-term momentum, pointing to a potential downturn.
The oscillator, which is used to signal the likelihood of a reversal in price direction, is also bearish. This is not a promising sign for those who are bullish on Bitcoin.
Lastly, the Average Directional Index (ADX), a tool used to gauge the strength of a trend, is weak. This suggests the current downtrend may not have the force behind it to sustain its trajectory.
Bitcoin’s Trade Setup & Outlook: The Path Ahead
Given the above indicators, the short-term outlook for Bitcoin appears to be somewhat turbulent. The price will likely retract toward the $28,000 support, forming an attractive swing entry for traders looking for a bullish resurgence.
The bearish short and medium-term SMA and MACD, along with a bearish oscillator, suggest further short-term downside may be on the horizon. However, a robust long-term uptrend and a weak ADX indicate this may be a short-lived trend, with a likely reversal on the horizon.
About Bitcoin: The Genesis of Digital Currency
Bitcoin is more than just a token; it is the digital gold standard that started it all. Launched in 2009 by an anonymous entity known as Satoshi Nakamoto, Bitcoin is a decentralized digital currency that operates on a peer-to-peer network. It was designed to offer a viable alternative to traditional fiat currencies and provide a means of transacting that was beyond the control of any government or entity.
Navigating Through Bitcoin’s Turbulence: A Summary
Bitcoin is experiencing turbulent times, with the price dipping below the critical support level of $30,000. But despite this short-term bearish outlook, the long-term trend remains robust. While technical indicators suggest potential short-term headwinds, Bitcoin’s long-term picture remains promising. As always, Bitcoin’s trajectory serves as a critical barometer for the broader cryptocurrency market so that any dramatic movements could have significant ramifications for other cryptocurrencies.