In this intriguing world of crypto, tokens are constantly undergoing massive shifts. So today, we turn our analytical gaze towards AAVE.
AAVE has had its fair share of turbulence, but there’s a glimmer of hope in the form of a technical pattern that could signal a trend reversal. So brace yourselves for a detailed technical analysis and our trading setup for AAVE.
About AAVE
AAVE has firmly established itself as a game changer in the world of Decentralized Finance (DeFi). Its unique selling proposition lies in its open-source and non-custodial protocol. This structure allows users to deposit assets and earn interest and borrow against those assets. Its innovative framework has disrupted the traditional financial system and given rise to a new wave of financial practices.
Transforming the Financial Landscape
The platform has been a force to reckon with in the DeFi sector, not only for its trailblazing solutions but also for its significant contribution to the democratization of finance. It has genuinely transformed the financial landscape, providing everyone equal access to financial services, regardless of geographical location. In doing so, it has ushered in an era of financial inclusivity and independence, empowering users around the globe.
Yet, despite these groundbreaking strides, AAVE has not been immune to the volatility that characterizes the crypto market. Recently, it has been swept up in a significant downtrend, much like many other tokens in the crypto space. The price has declined, underscoring the crypto markets’ unpredictable and often unforgiving nature. Despite its solid foundations and its profound impact on the DeFi landscape, AAVE, too, has to navigate the ebb and flow of market dynamics. It’s a potent reminder that even the most groundbreaking innovations are not exempt from market trends and sentiment.
Current Situation
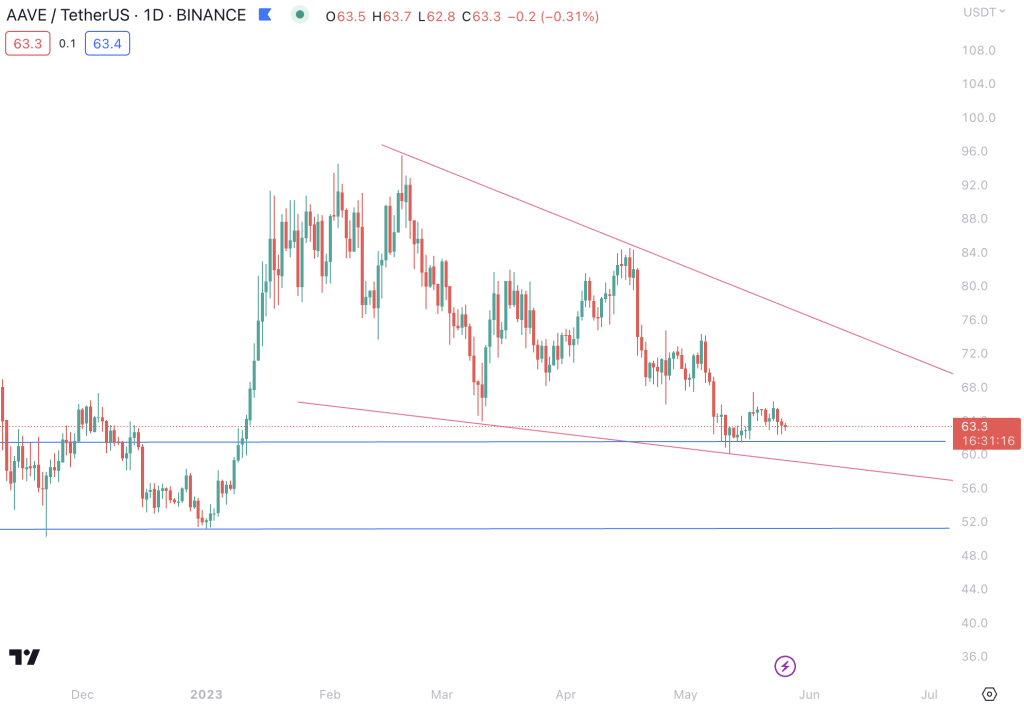
The recent weeks have certainly been a bit of a rollercoaster for AAVE. It’s become trapped in a relentless downtrend, slipping below significant landmarks that have traditionally provided a level of support. Key among these is its 200-day moving average and the all-important $70 mark. The price’s dive beneath these vital levels paints a somewhat bearish picture that’s difficult to ignore.
Further evidence of the bearish trend is provided by the Simple Moving Averages (SMAs) and Exponential Moving Averages (EMAs). These indicators help to understand the overall trend by smoothing out the price data and providing a clearer picture of the price direction over some time. However, most of them have been singing a bearish tune, indicating the consistency of the downward trend and further legitimizing the bearish outlook.
Despite these factors, it’s crucial to remember that in the cryptoverse, all is not always as it seems. Hope glimmers on the horizon in the form of a Falling Wedge pattern. This is a chart pattern known for its potential bullish reversal characteristics. The pattern starts wide at the top and contracts as prices move lower, creating a conical shape that could signal a bullish reversal despite its bearish environment. It’s like a beam of light piercing through a stormy sky – a ray of hope amidst the bearish milieu. The Falling Wedge pattern could be the catalyst we’re eagerly awaiting, potentially offering AAVE a way out of its current predicament and paving the way for a much-anticipated upward movement.
AAVE — Outlook and Recommendation
Now, let’s get to the crux of it – our trading setup. First, we wait for a bullish breakout from this Falling Wedge pattern, optimally above the $70 and 200-day moving average. Observing this would suggest that the buyers have overcome the sellers’ resistance, and the price is geared up to reverse trends.
While all RSI are neutral, the Ultimate Oscillator, MACD, and Momentum (MOM) are flashing bullish signals. This gives us some more reasons to believe in a potential trend reversal.

So, keep an eye out for the breakout. If it occurs, it might be the ideal time to consider opening a position. However, as always, remember to implement a sound risk management strategy to protect your capital.
AAVE — Summary
To summarize, AAVE is in a bearish phase right now, trapped in a Falling Wedge pattern. While most SMAs and EMAs are bearish, a few indicators, like the Ultimate Oscillator, MACD, and MOM, offer a glimmer of bullish hope. Our game plan patiently awaits a breakout above $70 and the 200-day moving average, indicating a potential trend reversal. This world of crypto is indeed a roller coaster, and the only way to enjoy the ride is by staying vigilant and making informed decisions. Here’s hoping AAVE finds its way out of the wedge soon!