ADA’s Current Trajectory
Cardano (ADA), one of the prominent players in the crypto arena, currently trades at $0.294. Witnessing a slight change of 0.89% in the past 24 hours, ADA’s market pulse beats steadily amidst turbulence.
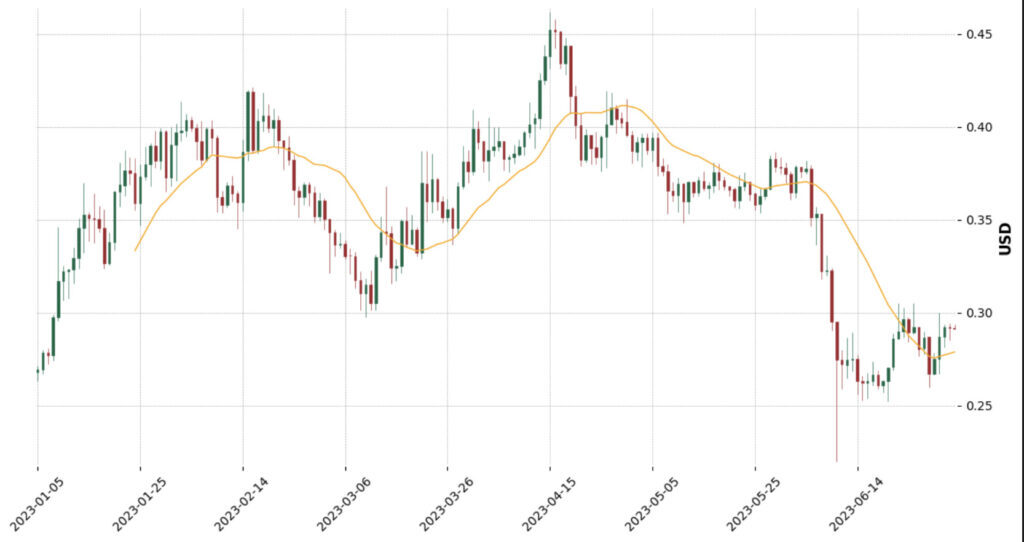
The coin experienced a bearish breakout from its Channel Up pattern, driving the price into oversold territory with a Relative Strength Index (RSI) of around 25. This precipitated a bounce near the $0.25 support line, catapulting the price to the close vicinity of the $0.30 resistance area. However, the resistance repelled the coin, keeping the desired breakthrough at bay.
There are two main possibilities for swing traders: a pullback near the $0.25 support for another swing entry or a break above the $0.30 resistance, promising an upside potential to $0.35 (200-day moving average).
For trend traders, the real game-changer would be a price break above the 200-day moving average, which could reverse the downtrend.
Technical Outlook: Analyzing ADA’s Indicators
Delving into ADA’s technical indicators, we find the market dynamics intricately illustrated.
Based on the moving average, ADA’s trend signals a short-term, medium-term, and long-term downtrend. The sequential downtrends underscore the bearish sentiment pervading ADA’s market.
The RSI currently sits at a neutral position. The absence of either overbought or oversold conditions illustrates an equilibrium between buying and selling pressures in the market.
The Moving Average Convergence Divergence (MACD), a momentum oscillator, flashes a bullish signal. This paints an optimistic picture of potential upward price movement in the near future.
The Ultimate Oscillator echoes the neutral stance of the RSI. Oscillators are important in identifying market reversals, and a neutral reading suggests an equal probability of an upward or downward move.
Anticipating ADA’s Journey: Trade Setup & Outlook
Given the current technical indicators and market conditions, ADA could be on the precipice of a significant move. A pullback to the $0.25 support area could present a new swing entry opportunity. Conversely, if ADA can muster enough momentum to breach the $0.30 resistance, we could see a rise toward the $0.35 mark (200-day MA).
However, the key level for trend traders to watch is the 200-day moving average. A break above this line could signal a trend reversal, putting ADA back on a bullish path.
ADA: The Verdict
In summary, ADA is currently at a critical juncture. The token’s future depends largely on whether it rebounds at the $0.25 support or breaks out at the $0.30 resistance. Technical indicators like the RSI, MACD, and the oscillator remain neutral, suggesting the market could swing either way. However, the strong ADX value indicates that when a move does occur, it’s
About Cardano ADA
Cardano’s ADA is more than just a cryptocurrency. As the native token of the Cardano platform, ADA enables owners to participate in the network’s operation. Beyond this, ADA serves as a digital currency, facilitating fast, direct transfers that are guaranteed to be secure through cryptographic means.