Cardano (ADA) stands tall as a blockchain platform with noteworthy academic roots, strategic development, and a loyal community in the mesmerizing realm of cryptocurrencies. But as with every cryptocurrency, ADA’s journey is both intriguing and complex. Let’s unravel its recent trajectory.
More about Cardano (ADA)
– Cardano (ADA) Analysis: What To Expect In September?
– ADA’s Dance at the Precipice: From Bullish Breakouts to Crucial Support at $0.25
– Unfolding ADA’s Potential: Ascending Towards a 29% Upsurge to $0.40
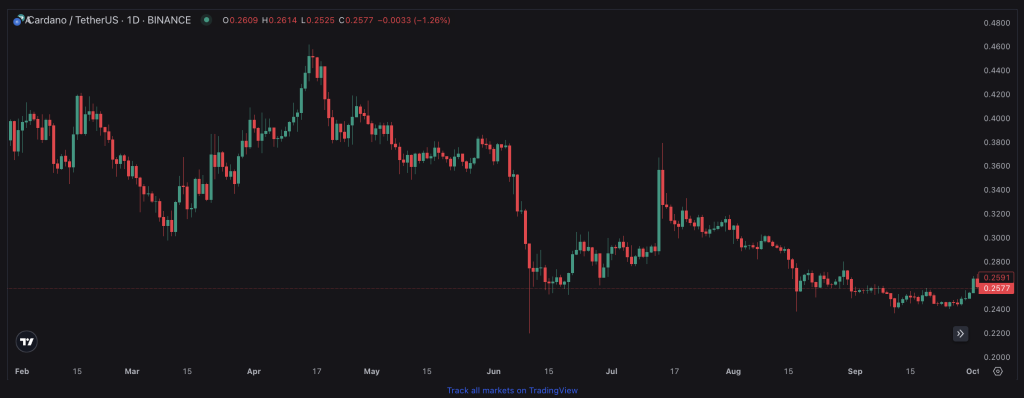
Cardano (ADA) — Current Stance and Price Performance
At a current trading price of $0.258, ADA has seen a minor dip of -0.983%. However, it’s essential not to get lost in the day-to-day fluctuations and instead focus on the broader trends. Over the last week, ADA has enjoyed a 4.94% uplift. Contrastingly, a slight monthly decline of -0.59% has been observed. If we dive deeper into its year-long narrative, the coin has retraced by -40.77%, touching an annual high of $0.4522 and dipping to a yearly low of $0.2421.
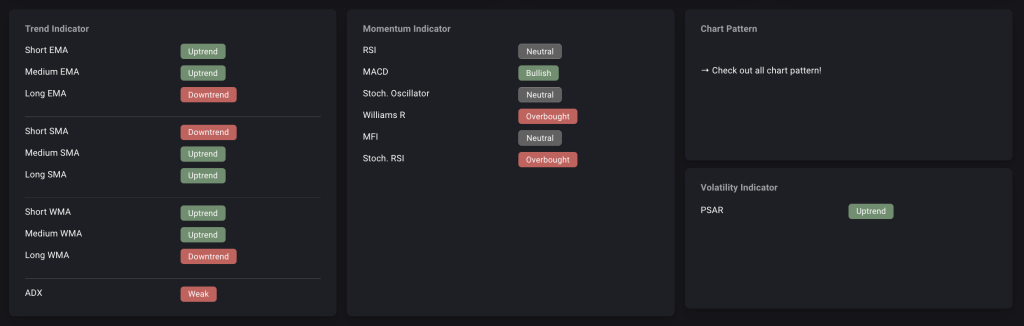
Cardano (ADA) — Trend Insights and Momentum Indicators
Cardano’s trend strength is currently evaluated as ‘weak’, but the overall sentiment leans towards a ‘buy.’ A mixed bag of trends can be observed across different time frames. While both short and medium-term EMAs and SMAs suggest an uptrend, the long horizon paints a more varied picture with both uptrends and downtrends interspersed.
Delving into the momentum indicators, a neutral RSI points to a balance between buying and selling pressure. The MACD, often used to catch early trend shifts, flashes a bullish sign. However, the overbought signals from the Williams R and Stochastic RSI should be cautiously approached. They hint that ADA might be in a region where it has been historically overbought, and a pullback or consolidation could be on the horizon.
Trade Recommendation
Given the technical indicators, here’s a potential approach:
- Short-Term Traders: The bullish MACD and the recent uptrend in ADA suggest potential short-term gains. However, given the overbought conditions, setting tight stop-loss levels is crucial. This ensures that if ADA begins to retrace, your position is secure.
- Medium to Long-Term Traders: The mixed signals from long-term trend indicators suggest a more cautious approach. It might be worthwhile to consider a staggered entry, buying portions of ADA over time. This ‘dollar-cost averaging’ ensures you don’t invest all at a potential peak.
- General Caution: The overbought signals should be closely monitored. If ADA shows signs of consolidation or a downturn, it might be worth revisiting your strategy. Adjust stop-loss levels accordingly.
In the world of crypto trading, it’s essential to remember that technical indicators are just tools in a vast toolkit. Combining them with fundamental analysis, market news, and a clear understanding of your own risk tolerance is vital.
ADA — The Path Ahead
Cardano’s PSAR, a tool used to gauge trend direction, is signaling an uptrend, aligning with many of the other bullish indicators.
In conclusion, Cardano’s recent market dance is emblematic of the broader crypto ecosystem—filled with promise yet peppered with challenges. As always, a diversified strategy, continual learning, and vigilance are essential. In this dynamic world, it’s not just about reading the signs but also about anticipating the turns ahead.
Stay tuned, stay informed, and may the Cardano journey bring both insight and fortune.
Your Next Step(s)
→ Check out the CryptoKnowledge for more ADA details & data
→ Start trading Cardano (ADA)