Ethereum’s (ETH) Current Status
Ethereum (ETH) currently trades at a value of $1,726. In the tumultuous world of cryptocurrencies, a 0.6% change in ETH’s price within the last 24 hours.
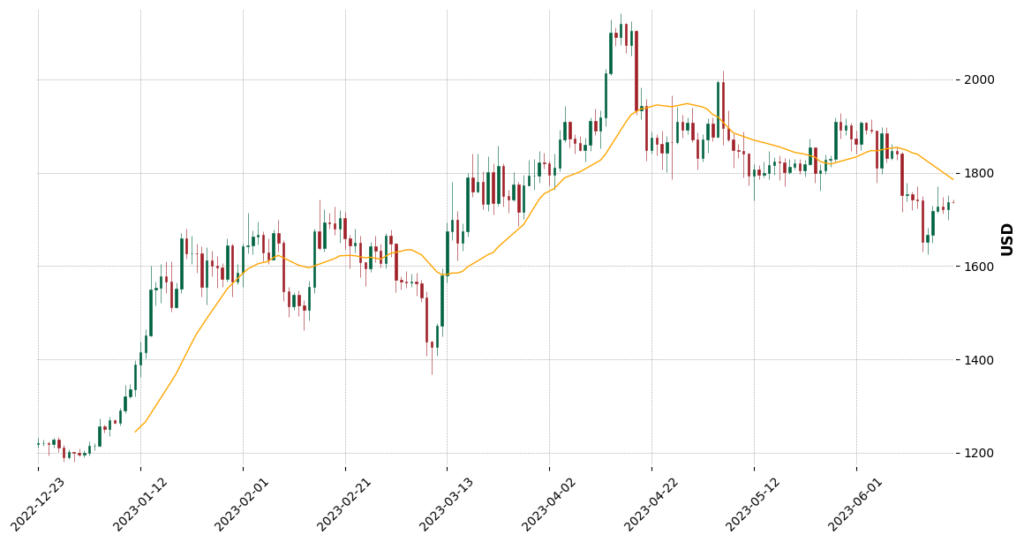
Regarding trade setup, the long-term scenario paints a picture of an ongoing uptrend. Interestingly, ETH recently witnessed a bearish breakout from a descending triangle pattern, typically a bearish formation.
This dip, however, was met with support from the 200-day moving average (~$1,630) and a long-term upward trendline – both acting as sturdy backstops. This bounce-back, coupled with rising MACD histogram bars, suggests a bullish inflection in momentum, hinting at a potential short-term bounce to $1,800 – a situation for which traders should remain alert.
The fight between the bulls and bears finds its battleground in support and resistance areas. The nearest Support Zone for ETH stands firm at $1,700, with subsequent support at $1,400. Conversely, resistance lurks around $1,800 (the previous support), followed by further resistances at $2,000 and $2,150.
Ethereum (ETH) — Technical Indicators
Traversing the crypto landscape necessitates understanding several technical indicators. Each indicator conveys meaningful insights about price action, trend strength, and potential market reversals.
Starting with the moving averages, the trends for ETH appear bearish across all timescales – short, medium, and long-term. Simply put, the market has been moving downwards across these durations. This is deduced from the fact that the price of ETH is below its Simple Moving Average (SMA) in all these time frames.
The Relative Strength Index (RSI), a momentum oscillator that measures the speed and change of price movements, currently remains neutral. This suggests that ETH is neither overbought nor oversold at the moment, leaving room for movement in either direction.
Moving Average Convergence Divergence (MACD), a trend-following momentum indicator shows a bearish trend. This suggests that the market has been moving downwards despite the overall long-term uptrend recently.
The oscillator, another important momentum indicator, also demonstrates a bearish sentiment, reinforcing the recent downward momentum indicated by the MACD.
The Average Directional Index (ADX), a tool that indicates trend strength regardless of its direction, is strong. This suggests that the current downtrend is potent, and traders should exercise caution while anticipating trend reversals.
Trade Setup & Outlook – Gazing Into ETH’s Crystal Ball
Based on the current indicators and market setup, the short-term outlook for ETH is cautiously optimistic. The token’s recent bounce from its 200-day moving average, coupled with the bullish inflection in momentum, suggests a potential short-term rebound to around $1,800. However, it’s important to remember that the overall short, medium, and long-term trends based on the SMA are bearish.
While the RSI is neutral, the MACD and Oscillator are bearish, indicating that the market has been moving downwards. Hence, traders should exercise caution and closely monitor market trends before making any decisions.
Support and resistance zones provide critical benchmarks. Should the price fall, the $1,700 mark acts as a formidable support line, followed by $1,400. Conversely, resistance zones at $1,800, $2,000, and $2,150 might stymie any bull run.
About ETH – The Digital Oil Powering the Blockchain Engine
Ethereum (ETH) is more than just a cryptocurrency. It’s a blockchain-based platform that enables developers to build and deploy smart contracts and decentralized applications. Acting as a form of “digital oil”, ETH facilitates transactions within the network, rewarding miners for their computational work.
ETH, the brainchild of Vitalik Buterin, debuted in 2015 and quickly emerged as a formidable contender to Bitcoin. Its versatile platform and robust development community have bolstered its status as a leading light in the crypto universe, with promising potential in the finance, supply chain, and gaming sectors.
Wrap-Up: Unraveling the Threads of ETH’s Tapestry
ETH, currently trading at $1,726, has seen a slight price change of -0.6% in the last 24 hours. Despite a recent bearish breakout, the long-term trend for ETH remains bullish. The price seems to find strong support at $1,700 and faces resistance at $1,800.
As per SMA, technical indicators show bearish trends in the short, medium, and long term. The RSI is neutral, while the MACD and Oscillator present bearish tendencies. However, despite these indicators, the current momentum inflection suggests the potential for a short-term bounce.
In the broader context, Ethereum remains a critical player in the decentralized applications landscape. As it facilitates a new generation of digital interactions, Ethereum’s potential surpasses its current price.
As always, traders should monitor the technical indicators and the global macro landscape influencing the crypto market. In the fluid world of cryptocurrencies, tides can turn rapidly, making it all the more important to stay informed and adaptable.