Current Status – Algorand’s Landscape
Trading currently at a humble $0.123, Algorand (ALGO) has seen a price decrease of -2.75% in the last 24 hours. Yet, traders might take this as an opportunity rather than a setback. A recent bounce at the $0.09 support level after becoming extremely oversold (RSI < 20) indicates that the bulls may be rallying to push back against the bears.
The real confirmation of a bullish trend reversal will come if the price can break above the downward trendline (represented as a blue line on most charts) and above the $0.18 mark to make a Higher High.
Algorand (ALGO) — Technical Indicators
Let’s examine key technical indicators to gauge ALGO’s potential future moves better.
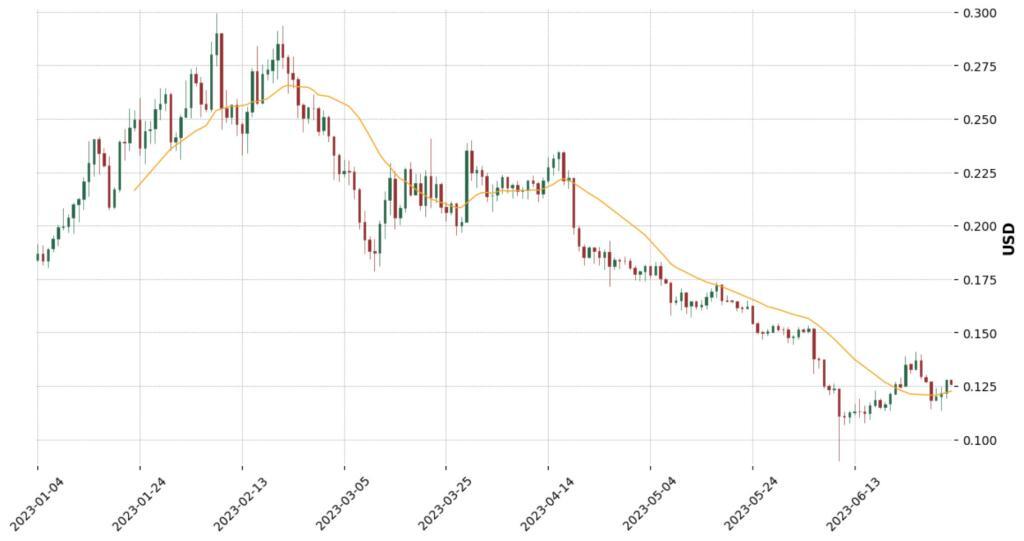
Trends based on Moving Averages (MA) in the short, medium, and long term suggest a downtrend, as indicated by the Simple Moving Average (SMA) across these periods. This reflects a recent loss of momentum in ALGO’s price, but this trend may be reversed.
The Relative Strength Index (RSI), an oscillator that measures the speed and change of price movements, indicates ALGO is oversold. Typically, an RSI below 30 suggests oversold conditions and could indicate an upcoming price reversal as the market corrects from the oversold state.
The Moving Average Convergence Divergence (MACD), which tracks the relationship between two moving averages of a token’s price, is bullish for ALGO. A bullish MACD can often be a precursor to potential positive price momentum.
However, the Ultimate Oscillator is currently bearish. The Oscillator compares the token’s closing price to the price range over a specific period, and a bearish signal could suggest that the market is in a selling phase.
Finally, the Average Directional Index (ADX) shows a strong trend. This indicates that the market is showing strong downward momentum. High ADX values can represent either a strong uptrend or a strong downtrend.
Trade Setup & Outlook – Charting the Course for Algorand
Based on the above indicators, ALGO is demonstrating some mixed signals. The oversold RSI combined with a bullish MACD might suggest that a price correction could be on the horizon. On the flip side, a bearish Ultimate Oscillator and strong ADX underline the strong downward pressure.
In the short term, a key level to watch is the downtrend line and the $0.18 mark. Should the price break through this level, it could signify a potential bullish trend reversal. However, traders should remain cautious and vigilant due to the strong ADX and bearish Oscillator.
About ALGO – At the Heart of Borderless Economy
Algorand (ALGO) is more than just a digital currency; it is a pioneering force in the blockchain universe. As the native token of the Algorand blockchain, ALGO is utilized for various purposes, including participation in the consensus protocol, payment for transaction fees, and executing smart contracts. Algorand’s unique pure proof-of-stake protocol and its commitment to delivering decentralization, scalability, and security make it a key player in the blockchain ecosystem.
Summary – Is a Turnaround in Sight for Algorand?
To summarize, ALGO is currently in a strong downward trend. Despite its recent struggles, however, certain key technical indicators hint at the possibility of a turnaround. With the RSI indicating oversold conditions and the MACD flashing bullish signals, ALGO could see a price correction in the near future.
Nevertheless, the bearish Oscillator and the strong ADX suggest that traders should exercise caution and closely monitor the price action. Remember, the world of cryptocurrency is as exciting as it is unpredictable, and keeping a close eye on market movements is essential. The key to successful trading lies in diligent research, informed decisions, and measured risk-taking.