Algorand (ALGO) has been a notable name in the crypto landscape. While its journey has been akin to a roller coaster ride, with its peaks and troughs, it remains a topic of both intrigue and analysis among crypto enthusiasts and investors alike. Today, we do a deep dive into ALGO’s latest price performance, have a look at the most essential technical indicators, and provide you with a detailed trade recommendation.
A Retrospective Look at ALGO’s Performance
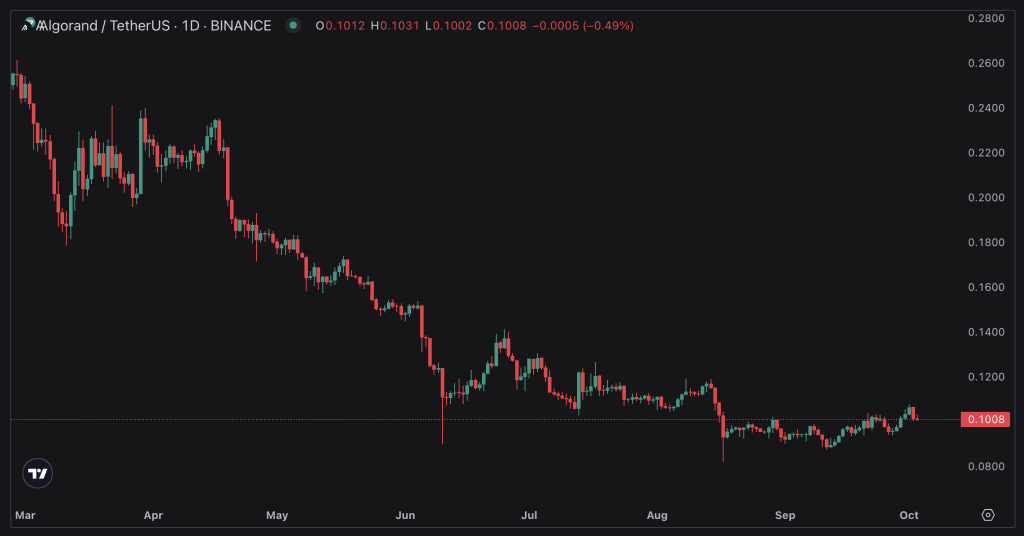
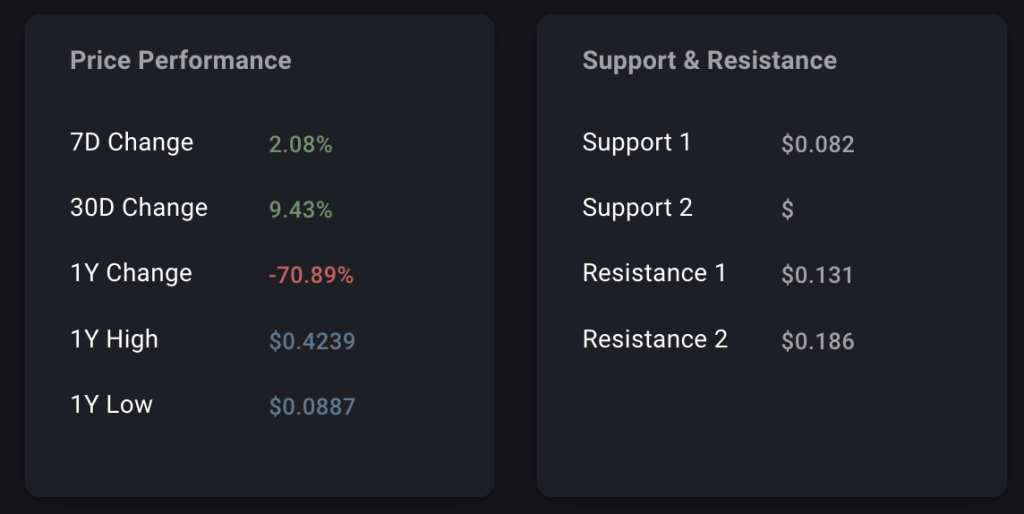
Over the past week, ALGO experienced a moderate but encouraging ascent, showcasing a 2.08% uptick. Expanding our scope to the past month, we observed a somewhat robust increase of 9.43%. These short-term gains, however, are contrasted sharply when looking at the annual statistics: a staggering decline of -70.89%.
Exploring the highs and lows within the past year, ALGO touched its zenith at $0.4239 and, unfortunately, descended to its nadir at $0.0887.
Anchors and Ceilings: Support and Resistance Analysis
Every crypto trader knows the significance of these metrics. For Algorand (ALGO), the major support level sits at $0.082, whereas the token faces major resistances at $0.131 and $0.186. Support and resistance levels can often act as psychological barriers for traders and can be instrumental in decision-making processes.
Alogrand (ALGO) — A Closer Look at Technical Indicator
While at first glance, Algo rand’s trend strength reading as ‘weak’ might seem concerning, delving deeper can offer more insights:
- EMA & SMA Dynamics: Short and medium EMAs and SMAs suggest an optimistic uptrend, hinting at bullish movements shortly. However, the long EMA’s downtrend and short SMA’s similar inclination serve as reminders of the inherent volatility and potential risks in the crypto world.
- WMA Outlook: On the WMA front, things seem largely positive. From short to long durations, the WMA portrays an uplifting uptrend.
- ADX Insights: A ‘weak’ reading from ADX resonates with the general trend strength. This warrants a meticulous and well-strategized approach for potential investors.
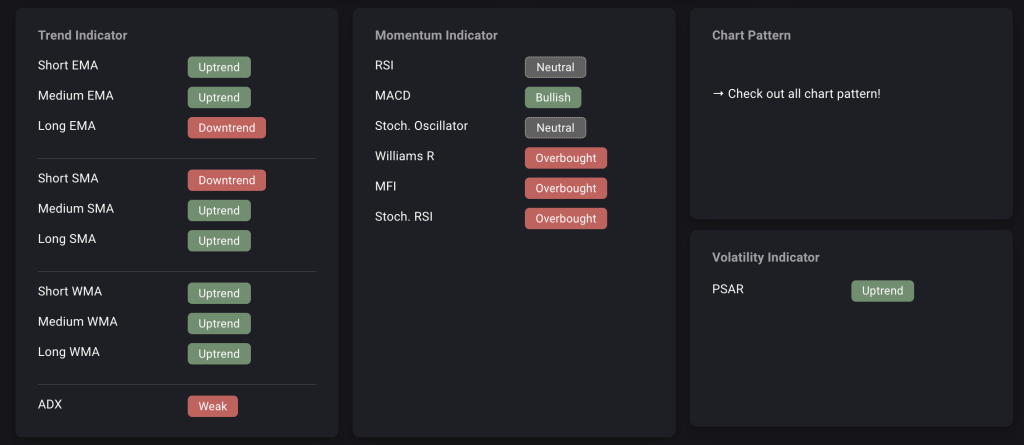
Momentum Indicators: ALGO’s Vital Signs
Momentum indicators often provide the clearest insights into a cryptocurrency’s health. While RSI is currently neutral, MACD’s bullish tilt gives hope to those betting on ALGO’s ascent. The Stochastic Oscillator and Stochastic RSI both maintain a neutral stance. However, caution is advised as the Williams R, MFI, and Stoch. RSI veers into overbought territory, potentially foreshadowing selling pressures on the horizon.
Assessing Volatility: The PSAR Perspective
PSAR (Parabolic Stop and Reverse), currently signaling an uptrend, offers a beacon of hope amidst the sea of diverse indicators, suggesting potential positive price movements for ALGO.
More about Algorand (ALGO)
→ Algorand (ALGO): What’s Needed For A Bullish Reversal
→ Climbing or Crumbling? ALGO’s Current Pulse & Predictions Revealed!
Algorand (ALGO) — Trade Recommendation
Before we provide a more detailed trade recommendation, we will summarize the most important factors required to derive a recommendation:
- Recent Performance: ALGO has demonstrated positive momentum in the short term, with a 2.08% increase over the last week and 9.43% over the past month. This might suggest that the asset is gaining traction among traders.
- Support and Resistance Levels: ALGO is currently trading close to its first support level ($0.082). On the upside, resistance is found at $0.131 and $0.186. These levels will be crucial in determining ALGO’s price trajectory.
- Trend Analysis: Most trend indicators, such as EMAs, SMAs, and WMAs, suggest an uptrend, which is a bullish sign. However, the Long EMA and Short SMA indicate a downtrend, suggesting potential near-term volatility.
- Momentum Indicators: While the MACD is bullish, some key indicators like Williams R, MFI, and Stoch. RSI is signaling overbought conditions. This might hint at a potential pullback or consolidation in the near term.
- Volatility Indicators: The PSAR indicates an uptrend, providing optimism for bullish traders.
Trade Recommendation
Short-Term Traders
Considering the overbought conditions and the current price near support, waiting for a potential pullback toward the $0.082 support level might be prudent before considering a buy. If ALGO breaks below this support, it could test the next available support (value not provided).
Long-Term Investors
While the 1-year performance has significantly dropped, the recent positive price action and bullish momentum indicators suggest that ALGO could have a potential upside in the long run. However, entering at a more favorable price, closer to the support level, could provide a better risk-reward ratio.
Risk Management
It’s essential to set stop-loss orders to protect your capital. A stop-loss just below the $0.082 support might be considered for short-term trades. The stop-loss level should be determined for long-term investors based on individual risk tolerance and investment horizon.
Wrapping Up: Where Does Algorand Stand?
Algorand’s journey over the past year has undoubtedly been tumultuous. Yet, recent positive trends and various bullish indicators hint at a resurgence. The world of cryptocurrency is inherently unpredictable, and ALGO’s trajectory is a testament to that.
For prospective investors, the advice remains consistent: Arm yourself with knowledge, appreciate the nuances, and always practice caution. As the dynamic world of crypto continues to evolve, what chapters Algorand will add to its narrative remains to be seen.
Your Next Step(s)
→ Check out the CryptoKnowledge for more ALGO details & data
→ Start trading Algorand (ALGO)