Analyzed Period
Daily Chart
Forecast Short-Term
Bearish
Forecast Long-Term
Bearish
ALGO Overview — Charting the Downfall
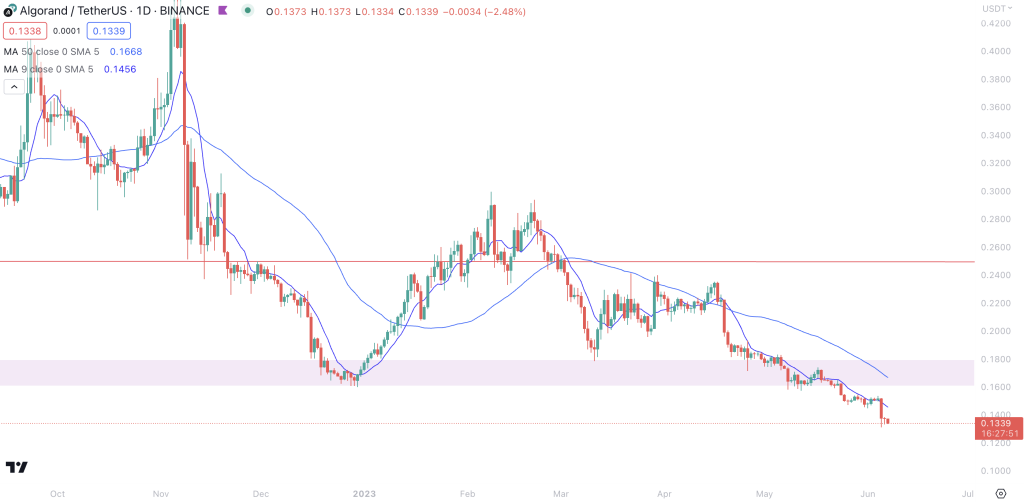
ALGO is trading at a humble $0.13, a slight dip of -2.27% in the last 24 hours. The token is on a clear bearish trend, starkly contrasting its previous highs. A detailed look at the chart reveals that the price was twice rebuffed at the $0.30 resistance, coinciding with its 200-day moving average (MA), marking the formation of a bearish Double Top. After these successive rejections, the price broke both the $0.25 mark and the crucial $0.16-$0.18 support zone below, thereby etching a new lower low on the charts. This combination of critical factors paints a clear picture of the current downtrend that ALGO is experiencing.
Technical Indicators for ALGO
Overview
Moving Average
Downtrend
RSI
Overbought
MACD
Bullish
Details
A deep dive into the technical indicators reveals a complex story. The moving average trends confirm the overall bearish bias. Short, medium, and long-term Simple Moving Averages (SMAs) indicate a downtrend, reinforcing the bearish sentiment.
The Relative Strength Index (RSI), on the other hand, signals an overbought condition. This typically suggests an imminent pullback or correction, indicating that the asset might be overvalued.
The Moving Average Convergence Divergence (MACD), an indicator that tracks momentum, suggests bullish sentiments. This divergence from the overall bearish outlook could hint at potential buying opportunities for investors looking for an entry point soon.
Meanwhile, the oscillator, which helps determine market momentum, also signals bullish sentiments. This contradicts the general bearish view and could suggest underlying strength in ALGO’s price action.
Lastly, the Average Directional Index (ADX) shows strong trends. ADX values above 25 typically indicate strong trend strength; in this case, it might imply a solid downward trend. However, it’s essential to consider this in conjunction with other indicators.
An Uncertain Tomorrow: Forecasting ALGO’s Short-Term Price
Based on the current technical indicators, the short-term outlook for ALGO remains somewhat ambiguous. The overall bearish trend, backed by moving averages and the strong ADX, suggests that the downtrend might continue for a while. However, the bullish signals from the MACD and the oscillator hint at potential volatility and possible short-term recovery.
Investors need to keep an eye on these contradicting signals. The overbought RSI condition might imply a possible correction in the short term, potentially causing the price to dip further. If ALGO retains its current support level and the MACD and oscillator bullish signals hold, we might see some relief from the bearish grip, albeit momentarily.
About ALGO
Algorand (ALGO) is a high-performance blockchain platform designed for real-world applications. Founded by MIT professor Silvio Micali, ALGO aims to solve the blockchain trilemma by offering scalability, security, and decentralization without compromising any of these crucial aspects. Its open-source, permissionless, proof-of-stake protocol promises instant transaction finality and true decentralization, offering a novel approach to smart contracts and tokenization.
Recap
To summarize, ALGO is witnessing a bearish trend, with the price facing strong resistance and breaking below crucial support levels. Technical indicators paint a mixed picture of the moving averages.