September, historically, has been one of the worst months for cryptocurrencies. However, this article discusses the current Polkadot price and why there’s some glimmer of hope for September.
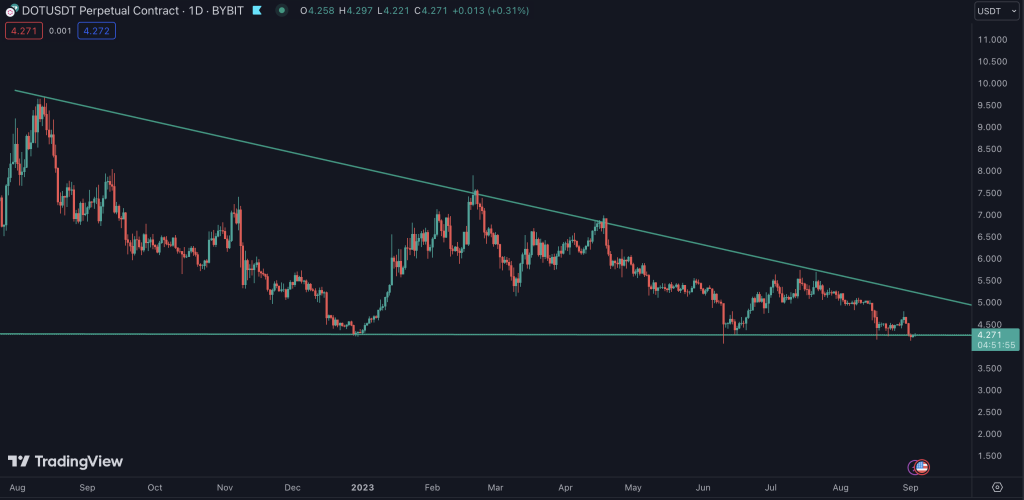
Polkadot (DOT) has recently seen a flurry of activities, currently hovering around the $4.27 mark, representing a modest 24-hour increment of +0.3%. This might appear like a minimal movement for casual observers, but seasoned crypto enthusiasts recognize that every decimal movement tells a story. The past seven days have witnessed a rebound in DOT’s pricing, surging by 5.77%, a commendable rally after the dip experienced in the past month (-8.44%) and the overall yearly downtrend (-33.17%).
Technical Indicators — The Underlying Stories of the Polkadot Price Trends
A keen assessment of Polkadot’s (DOT) technical indicators provides fascinating insights. The recent bullish tendency is emphasized by the short-term Exponential Moving Average (EMA) and Simple Moving Average (SMA), both highlighting an uptrend. Yet, there’s more to the story. In the broader timeframe, other moving averages suggest continuing the bearish atmosphere despite these short-term gains.
A remarkable observation is the Average Directional Index (ADX), which shows a strong trend. This metric doesn’t specify the direction (upward or downward), but it showcases that the Polkadot price is moving with conviction.
The momentum indicators like RSI, MACD, and others predominantly lean towards a neutral stance, save for the Stochastic RSI, which hints at an overbought scenario.
Overall, this could signal a potential slowdown or correction shortly. Furthermore, the Parabolic SAR (PSAR) adds another layer to our analysis, signaling a supporting uptrend and emphasizing that Polkadot’s journey is replete with opportunities and challenges alike.
Trade Setup & Outlook: Navigating the Short-Term price action of Polkadot
Given the indicators’ mixed signals, the Polkadot price’s immediate future is not crystal clear.
While the short-term uptrend provides a semblance of hope for bullish traders, the overbought Stochastic RSI suggests caution. The prudent strategy for traders, especially swing traders, might be to hold onto their Polkadot (DOT) positions, closely monitor the market signals, and await clearer buy or sell indications.
The current neutral momentum indicators don’t provide strong sell-or-buy signals, thus advocating for a wait-and-see approach.
Read more latest updates:
→ Crypto Analysis: What’s Next For Polkadot?
→ Trading Snapshot – 25 AUG 2023: Taking Some Risk Pays Off
Wrap-Up — What’s Next for the Polkadot Price?
Polkadot’s (DOT) current landscape is filled with nuances. Its recent short-term positive strides contrast with its longer-term challenges. Technical indicators like the EMA and SMA reflect short-term optimism, whereas others urge caution. The ADX’s strong trend indicator and mixed momentum metrics suggest that the Polkadot price is at a crossroads.
With its ambitious goals in the decentralized web space, DOT remains a token to watch, requiring investors to maintain a balanced approach: being optimistic yet cautious.
About Polkadot (DOT): The Web3 Contender
Polkadot, commonly referred to as DOT, is not just another cryptocurrency. It’s a multi-chain interchange and translation architecture that facilitates blockchain networks to work together seamlessly. Conceptualized by Dr. Gavin Wood, one of the co-founders of Ethereum, DOT’s primary goal is to enable different blockchains to transfer messages and value trust-free, aiming to make a web where our data is our own. It isn’t stored on a server owned by an intermediary company. It’s a promising contender in the race towards a decentralized web, Web3.
Your Next Step(s)
→ Check out the CryptoKnowledge Platform and enhance your trading skills
→ Start trading Polkadot