Aptos (APT) recently broke out of a falling edge and seemed to be ready for a massive surge. We looked closer at the token’s technical indicators and potential price targets.
Aptos (APT) Current Status: A Price Surge Amid Volatility
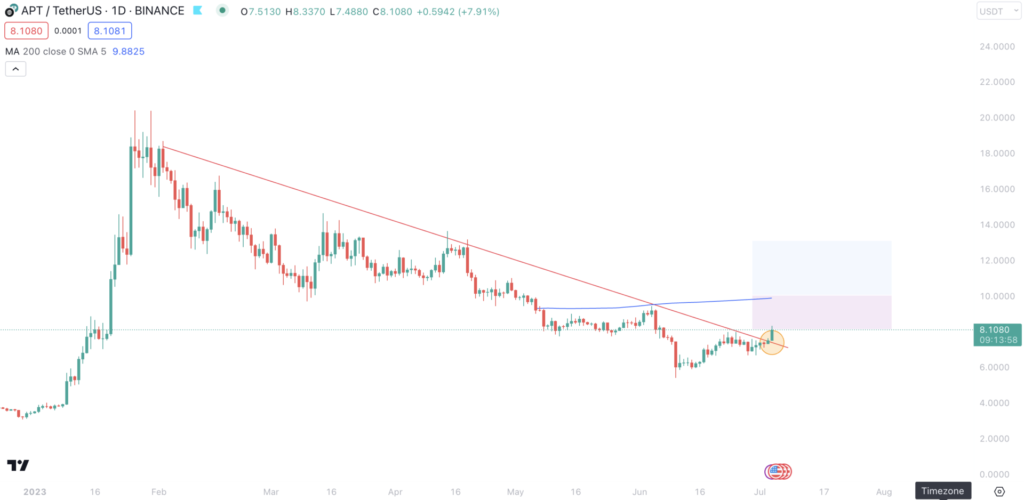
APT, the native token of the Aptos blockchain, currently trades at $8.15, marking an 8.5% increase in the last 24 hours. This upswing follows a bearish breakout from a Falling Wedge pattern.
The APT token had plunged into oversold territory (RSI < 30) near the $5.00 support mark before bouncing back. Now that it has broken above the $8.00 resistance line, this could signal a possible trend reversal, albeit a higher-risk one, as the overall trend remains bearish. But the trend’s complexion seems to be improving, paving the way for potential growth toward the next resistance at $10 — which would result in a 25% surge!
Aptos (APT) Technical Indicators
Despite the overall bearish outlook, APT’s short-term trend based on its moving average has recently turned bullish. This hints at a possible turnaround in the market sentiment, at least in the short run. However, the medium-term and long-term trends based on the simple moving average (SMA) are still a downtrend. This suggests that the general market sentiment for APT continues to be bearish over longer periods.
The Relative Strength Index (RSI), which gauges the speed and change of price movements, is currently neutral for APT. This indicates that the market is neither overbought nor oversold and that the token is currently fairly priced.
Interestingly, the Moving Average Convergence Divergence (MACD), which is used to identify potential buy and sell signals, is bullish for APT. This suggests that the momentum could be shifting toward a bullish phase.
The Ultimate Oscillator combines short-term, intermediate-term, and long-term price action into one oscillator and is also bullish. This indicates a shift in momentum towards buying pressure.
Finally, the Average Directional Index (ADX), used to measure the strength of a trend, is strong. This indicates a potential continuation of the current trend, be it an uptrend or downtrend.
Trade Setup & Price Forecast
Putting all technical indicators together, the story can be read as follows: Aptos broke out of the falling wedge (which is a massive bullish sign). On top of that, more and more indicators are turning bullish.
Therefore, a trend reversal for APT is possible, given the current trend and technical indicators. As stated initially, we see a first target at the resistance of $10. Depending on the overall market, the next resistance is at $13. However, to reach this target, Aptos would definitely need some broader support from the market.
However, it’s critical to remember that the long-term trend remains bearish, signaling that this trade setup is higher risk.
About Aptos (APT): Harnessing the Power of Blockchain
Aptos is a proof-of-stake blockchain platform hosting its native token, APT. Aimed at fostering a decentralized ecosystem, Aptos leverages scalable and secure technology to support next-generation dApps, with interoperability being its core strength. The project aims to solve many of the existing problems in today’s blockchains, such as scalability issues and lack of cross-chain communication.
Wrapping It Up — APT’s Battle to Shift Momentum
While APT faces an uphill battle to overturn its current bearish trend, there are signs that a short-term rally might be in the cards.
APT’s short-term moving average has turned bullish, and some key indicators flash optimistic signals.
The recent price bounce and the break above the $8.00 resistance might point toward a potential trend reversal. However, the long-term downtrend and the overall bearish sentiment demand cautious optimism. For now, APT appears to be a higher-risk trading prospect, and traders should tread carefully while navigating these volatile markets.