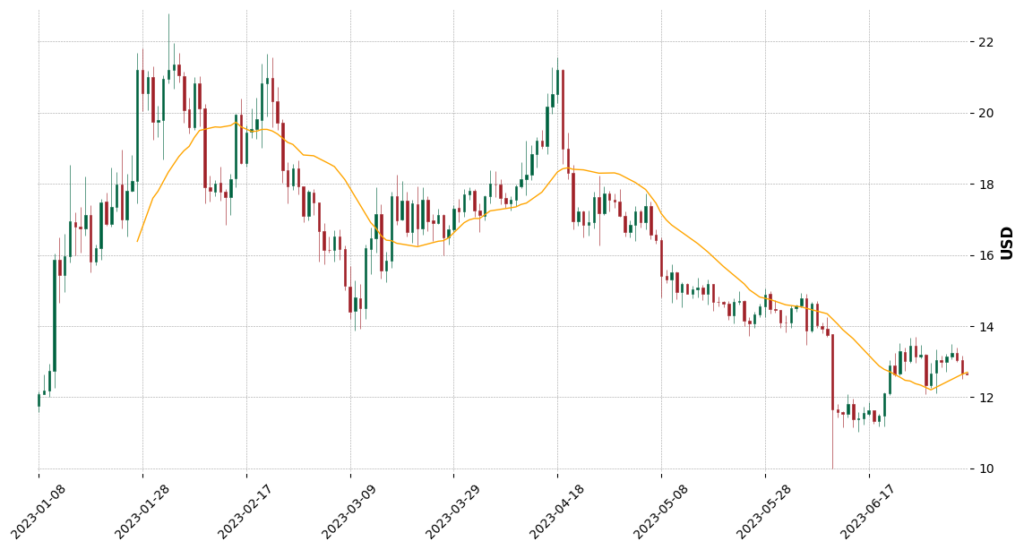
Current Scenario – “AVAX’s Rocky Road: A Snapshot of Avalanche’s Market Status”
Trading at $12.63, AVAX’s price hasn’t changed much in the last 24 hours, with only a marginal -0.01% difference. The Avalanche token remains on a downtrend following a bearish breakout from an Ascending Triangle, an ominous pattern often preceding a downturn. Upon reaching the $10 support level, the token dipped into oversold territory with an RSI below 30, indicating heavy selling pressure.
However, this level, which also served as steadfast support in late 2022, triggered a bounce back, providing some relief to AVAX holders. The price is now approaching the $14 resistance zone. Yet, a bullish trend reversal will only be signaled once the price breaks above the 200-day moving average, currently sitting at around $16. Upon achieving this, the token holds the upside potential to reach the $22 mark.
An Analysis of AVAX’s Technical Indicators
The Simple Moving Average (SMA) trends for AVAX present a bearish picture across short, medium, and long-term periods. This consistent downtrend suggests that the token has been unable to break free from its bearish stranglehold for some time.
The Relative Strength Index (RSI), used to measure overbought and oversold conditions, sits in the neutral zone. This means that the recent selling pressure has subsided somewhat, leaving the token in a state of equilibrium.
The Moving Average Convergence Divergence (MACD), a trend-following momentum indicator, remains bearish, implying that the sellers still have the upper hand. Similarly, the Oscillator, which helps identify market extremes and turning points, is also bearish, indicating a potential continuation of the current downtrend.
Finally, the Average Directional Index (ADX), which measures trend strength, is weak. This suggests that the current bearish trend isn’t particularly robust and could be susceptible to reversals.
Trade Setup & Outlook
Given the predominant trend and technical indicators, the short-term forecast for AVAX appears bearish. Despite a recent bounce from the oversold region, the price continues to face resistance at $14. A bullish trend reversal seems unlikely without breaking past the 200-day moving average at $16.
However, it’s worth noting that the weak ADX may indicate a trend reversal is on the horizon. Traders should be vigilant for any signs of a bullish shift, particularly a sustained move above the $16 mark. If the bullish trend reversal materializes, a rise toward the $22 target could be on the cards.
About AVAX — Unleashing the Power of Blockchain”
Avalanche (AVAX) is a high-performance, scalable, and secure blockchain platform. It uses a novel consensus protocol to support millions of nodes for a decentralized network. AVAX, the native token of the platform, serves multiple purposes like fees for transactions, staking, and providing a basic unit of account between the multiple subnets within the Avalanche system.
Avalanche (AVAX): Facing the Downward Drift with Potential for Revival”
In summary, AVAX is currently navigating through a bearish phase, struggling to breach key resistance levels. Despite this, its bounce from the oversold region and the weak ADX offers a glimmer of hope for a potential trend reversal.
At the heart of Avalanche lies an ambitious vision of a high-performance, scalable blockchain ecosystem. The token’s future heavily relies on the project’s ability to deliver on its promise and market conditions. As the token grapples with bearish trends, the upcoming days will be critical in determining whether AVAX can weather the storm and embark on a bullish journey. As always, traders should stay alert to changing market signals and adjust their strategies accordingly.