AVAX’s Current Scenario: Trading at the Crossroads
AVAX, the native cryptocurrency of Avalanche, is currently trading at $13.18, marking a slight 24-hour price change of 0.42%. It remains in a downtrend but exhibits signs of a potential turnaround.
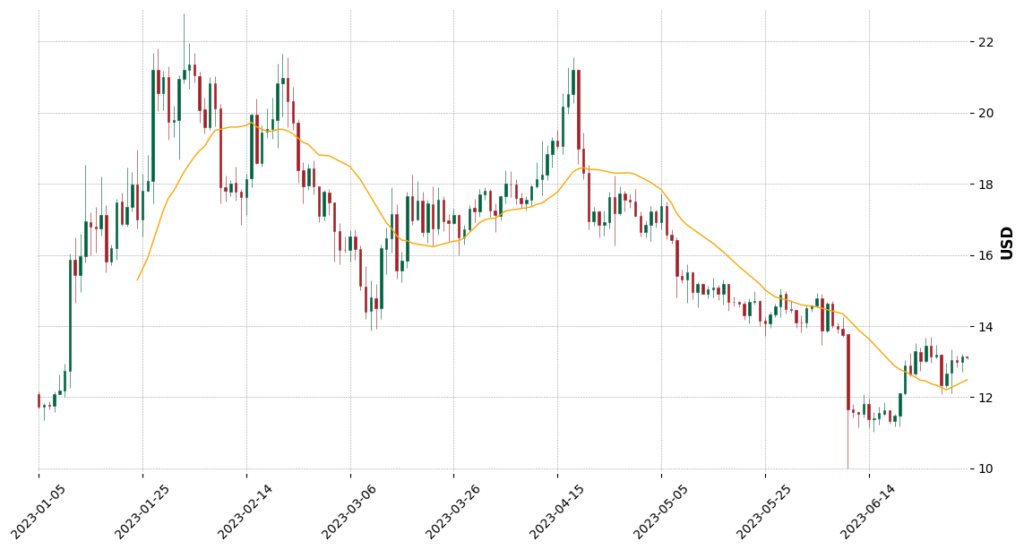
After a bearish breakout from an Ascending Triangle pattern, AVAX reached the $10 support level. At this point, the price dipped into oversold territory (RSI < 30), triggering a bounce back. This support level is significant, having also held up in late 2022. Currently, AVAX’s price is approaching the $14 resistance zone, but the real test lies ahead. It needs to break above the 200-day moving average (~$16) to signal a bullish trend reversal, offering an upside potential to $22.
Breaking Down AVAX’s Technical Indicators
Looking closely at AVAX’s technical indicators unveils the dynamic undercurrents of the market.
Trends based on the moving average show a short-term uptrend, indicating a positive price movement in recent times. However, both the medium and long-term simple moving averages (SMA) paint a downtrend picture, hinting at bearish sentiment in broader time frames.
The Relative Strength Index (RSI), a momentum oscillator that measures the speed and change of price movements, is neutral. This suggests an equilibrium between the buying and selling pressures in the market.
The Moving Average Convergence Divergence (MACD), another momentum indicator, is flashing bullish. It indicates a potential upward shift in the price movement, fostering an optimistic outlook.
Contrastingly, the Ultimate Oscillator, a technical indicator used to gauge market momentum, is bearish. This could imply slowing upward momentum or potential downward price action.
Finally, the Average Directional Index (ADX), an indicator used to measure the strength of a trend, is weak. This suggests that the current price trend lacks strength, and a reversal or consolidation could be on the horizon.
AVAX: Trade Setup & Forecast
Given the above indicators and the current market situation, AVAX’s short-term outlook appears cautiously optimistic. The price action appears to be testing the $14 resistance zone, with a significant hurdle at the 200-day moving average.
A successful breakout above these levels could catalyze a bullish trend reversal. The MACD, being bullish, supports this potential upside. However, the bearish Ultimate Oscillator and weak ADX imply a lack of strong momentum and trend strength, which could stymie this progress. Traders should watch for a decisive break above the 200-day moving average to confirm the start of a bullish trend.
Wrap-Up
In summary, AVAX is at a critical juncture, trading near a key resistance zone after rebounding from oversold levels. The short-term uptrend and bullish MACD hint at a potential bullish trend reversal, with the 200-day moving average being the level to watch.
However, the bearish Ultimate Oscillator and weak ADX underscore the need for caution, as they suggest a lack of strong momentum and trend strength. As always, in such a situation, careful monitoring of market movements and swift response to changes is key to successful trading.
About Avalanche (AVAX)
AVAX is the native cryptocurrency of the Avalanche platform. Avalanche is a decentralized, open-source platform that enables developers to launch decentralized applications and enterprise blockchain deployments in one interoperable, highly scalable ecosystem. AVAX plays a key role in securing the network, paying for fees, and providing a basic unit of account between the multiple subnets in the Avalanche system.