Current Status of AXS
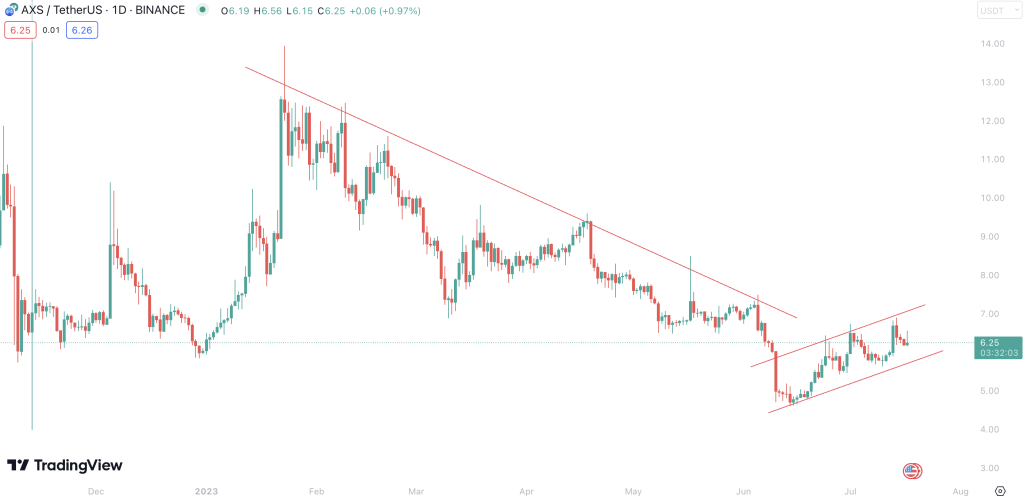
At the time of writing, AXS trades at $6.28, reflecting a modest 1.2% increase in the past 24 hours. The market situation presents a mixed bag as the token navigates volatile waters. The critical levels we’re eyeing are an ongoing Rising Wedge pattern and the previous $6 resistance.
Following a bearish breakout from a Descending Triangle pattern and a subsequent dip below $6, the token touched a new low, signaling a downtrend. However, AXS has since shown a resilient bounce, breaking back above the $6 resistance, hinting at a possible trend reversal on the horizon.
An In-depth Look at AXS’s Technical Indicators
Its technical indicators often reveal the market’s underlying strength and direction. In AXS’s case, the short and medium-term trends based on the simple moving averages (SMA) appear neutral, with no definitive direction. The long-term SMA, however, suggests a downtrend.
The Relative Strength Index (RSI), a measure of price momentum, is neutral. This signals that AXS’s buying and selling pressure are currently well balanced, which, in turn, means that the token’s price might move sideways in the short term.
On the other hand, the Moving Average Convergence Divergence (MACD) indicator is bullish, suggesting positive momentum and potential upside for the token in the near term.
The oscillator for AXS is neutral, indicating that the token is neither in the oversold nor overbought territory. This condition often precedes a potential breakout in either direction.
Finally, the Average Directional Index (ADX), used to quantify trend strength, is weak. This suggests that AXS might not be in a strong trend currently, and traders should possibly prepare for a phase of price consolidation or range-bound movement.
AXS: Trade Setup & Outlook
Given the above analysis, the immediate future of AXS seems to hinge on how the token reacts to the $6 level. Should AXS maintain above this level, we could see a possible trend reversal from the previous downtrend. However, the neutral short-term and medium-term trends and a weak ADX suggest that AXS might continue in a sideways movement before a clear trend emerges.
Traders should continue monitoring the $6 level, as any sustained movement above or below this mark could potentially signal the direction of the next significant price move.
Behind the Token: About AXS
Axie Infinity Shards (AXS) is the native utility token of the Axie Infinity ecosystem – a digital pet universe where players can earn tokens by gaming. Developed by Sky Mavis, the platform uses AXS for governance and other functionalities. It represents a new breed of gaming economies where play-to-earn models allow players to receive tangible rewards for their time and efforts in the game.
Piecing it Together
In sum, AXS currently stands at a potentially pivotal point. The token’s current neutral short and medium-term trends juxtaposed with a long-term downtrend present a mixed picture. Key levels to watch are the previous resistance at $6 and the evolving Rising Wedge pattern. The market currently lacks a strong directional bias, as indicated by the weak ADX.
Yet, bullish cues from the MACD may provide some optimism for AXS holders. Close monitoring of these crucial indicators and price levels will be vital for any trading decisions. At its core, AXS represents a promising project in the burgeoning play-to-earn gaming space, adding another layer to its investment potential.