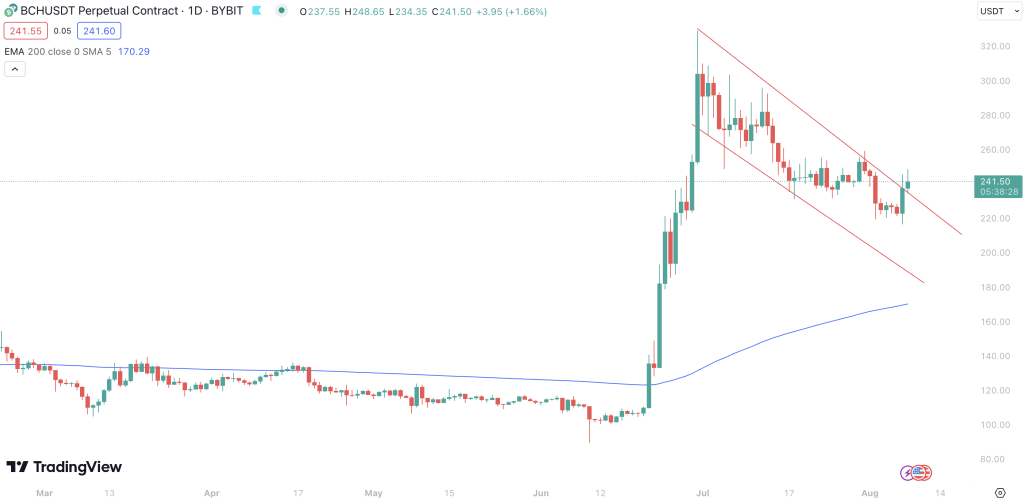
BCH has certainly turned heads in the crypto market, surging significantly. Currently valued at $241, the coin has witnessed a 1.6% price change in just the past 24 hours. The spectacular gains of over 100% came swiftly, pushing the Relative Strength Index (RSI) past the 70 mark, signaling that BCH was overbought.
While the ascent was remarkable, it faced stiff resistance at the $330 mark. Sensing a prime opportunity, traders began cashing in on their gains, exerting selling pressure on BCH. The consequence was a bearish breakout from the Descending Triangle pattern.
Falling below the $250 support, BCH might potentially dip to a $200 value next. A major trigger for this rally was the launch announcement of a new crypto exchange, EDX, which listed BCH among the top digital currencies.
BCH Technical Indicators: Interpreting the Momentum and Volatility
- Moving Average Trends: Recently, BCH displayed an impressive short-term uptrend. The Simple Moving Average (SMA) further indicates a medium-term uptrend. Even in the long-term scenario, BCH maintains its upward trajectory, painting a predominantly bullish picture.
- RSI (Relative Strength Index): As of now, the RSI stands at neutral. This indicates that while BCH was recently in an overbought territory, it has now corrected itself, balancing out buying and selling pressures.
- MACD (Moving Average Convergence Divergence): The MACD is in a bullish phase, suggesting that the short-term momentum of BCH is higher than its long-term momentum. This means that positive momentum is on the horizon.
- Oscillator: The oscillator presents a bullish front. This typically means that the latest closing price is higher than previously observed closing prices.
- ADX (Average Directional Index): With an ADX indicating ‘Strong’, it signals that BCH is witnessing a strong trend, whether it’s bullish or bearish. The strength of the trend is a crucial piece of information for traders.
BCH Trade Setup & Outlook
Despite the strong bullish indicators, traders should exercise caution. The bearish breakout from the Descending Triangle pattern and the resistance faced at $330 suggests potential headwinds. While the MACD and Oscillator remain bullish, indicating upward momentum, the fall below the $250 support is concerning.
Given the strength of the trend (as per the ADX), traders might brace themselves for significant price movements. If BCH doesn’t reclaim its position above $250 in the short term, we might witness it targeting the $200 mark.
Traders should monitor market sentiments, especially any news or updates related to the EDX exchange, as it played a pivotal role in the recent BCH rally.
About BCH: Deciphering Bitcoin’s Offspring
Bitcoin Cash, commonly known as BCH, emerged from a fork of Bitcoin in August 2017. Created to address scalability issues faced by Bitcoin, BCH increased the block size, allowing for more transactions to be processed. Over the years, BCH has distinguished itself, becoming a top-tier cryptocurrency. It aims to serve as digital cash, ensuring quick, low-cost transactions for users worldwide. While it has its critics and proponents, BCH’s standing in the crypto market is undeniable.
Summary of the Text: BCH’s Rollercoaster Ride
BCH experienced a rapid price surge, facing resistance and witnessing selling pressures. While it boasts strong bullish technical indicators, the bearish breakout from the Descending Triangle pattern cannot be ignored. The coin, currently priced at $241, has the potential to dip further, potentially targeting the $200 mark in the short term. However, BCH’s historical resilience and its recent endorsement by the EDX exchange suggest that it remains a formidable player in the crypto world.