A Downward Spiral or a Potential Rebound?
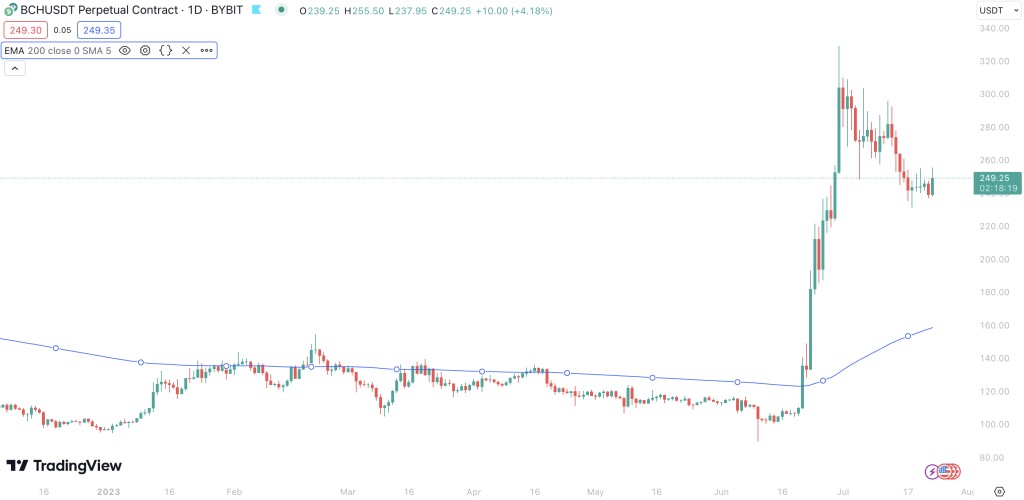
Bitcoin Cash (BCH), an offshoot of Bitcoin, is presently trading at $250, marking a 4.3% surge in the past 24 hours. The price spiked following the EDX crypto exchange’s launch announcement, which initially listed BCH among other major cryptocurrencies.
BCH experienced an impressive rally with over 100% gains, reaching a resistance level of $330. However, increased selling pressure from traders eager to take profits led to a bearish breakout from a descending triangle pattern, pushing the price below the $250 support line. With the potential for a dip towards the $200 mark, investors are holding their breath.
Bitcoin Cash — Technical Indicators
Technical indicators provide insights into market trends and price direction. Let’s examine the key indicators for BCH:
Trends based on moving average: Short-term trend indicates a downturn, suggesting selling pressure in the market. Meanwhile, both medium and long-term trends show an uptrend, indicative of bullish sentiment in the bigger picture.
RSI: The Relative Strength Index is neutral, indicating that the market is balanced with equal buying and selling pressures.
MACD: The Moving Average Convergence Divergence is bearish. This points to a potential downward price movement in the near term.
Ultimate Oscillator: The Ultimate Oscillator also indicates bearish momentum, supporting the MACD’s sentiment of a potential downtrend.
ADX: The Average Directional Index shows strong trends. Although it doesn’t indicate the trend’s direction, a strong ADX combined with other bearish signals could signify a strong downward price movement.
Trade Setup & Outlook: A Strategy for Bitcoin Cash’s Uncertain Times
In the current landscape, swing trading could be a suitable approach. With BCH hovering around the $250 mark, traders might consider setting a stop-loss order slightly below this level, perhaps at $245. This stop-loss order can protect traders from significant losses if BCH continues its descent.
For potential gains, traders should watch for BCH to break the current bearish pattern. A confirmed break above the $260 resistance could signal a trend reversal and a return of the bulls. If this happens, a logical target for taking profits could be set at $280, the mid-point between the current price and the previous high of $330.
A dollar-cost averaging (DCA) strategy might be appropriate for those bullish on BCH in the long term. This approach involves investing a fixed amount in BCH at regular intervals, regardless of the price. This strategy reduces the impact of volatility and negates the need to time the market perfectly.
About BCH: More than Just a Bitcoin Spin-off
Bitcoin Cash (BCH) is a cryptocurrency that forked from Bitcoin in 2017. With an increased block size, BCH allows more transactions to be processed, increasing scalability. It’s aimed at being a viable currency for daily transactions, maintaining the original vision of Bitcoin as “peer-to-peer electronic cash.”
This trading opportunity was identified by using our innovative crypto screener tool, designed to spot market trends and potential investment opportunities in the crypto space.
Summary — BCH at a Crossroads
Bitcoin Cash has been on a rollercoaster ride recently, skyrocketing to $330 before a bearish breakout pushed the price below the $250 support line. Current indicators suggest a potential downward trend in the short term. However, with its medium and long-term trends pointing towards a bullish direction, BCH could be in for a reversal. Careful observation and judicious trading are keys in the volatile crypto market.