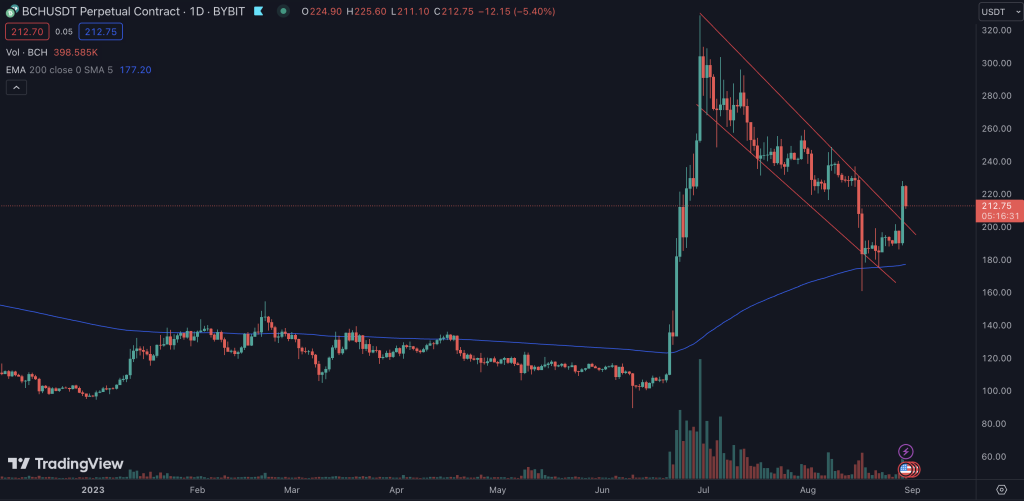
BCH, short for Bitcoin Cash, has experienced quite a remarkable trajectory recently. Currently trading at $212, it has seen a 5.3% decrease in the past 24 hours. Notably, the crypto space was abuzz as BCH demonstrated a bullish breakout from a Channel Down pattern, hinting at a potential uptrend resumption.
The near-term prospects look promising, with a potential upside to $250, and if the momentum keeps up, we could even see BCH push toward the $330 mark. The positive surge in BCH’s price, particularly the whopping 200%+ rise from its $100 level, was not merely a whimsical market trend. It gained solid traction after announcing a new crypto exchange, EDX, which featured BCH among its initial listings alongside giants like BTC, ETH, and LTC.
Technical Indicators: Navigating Through BCH’s Pulse
- Moving Average Trends: In the crypto world, moving averages often provide a clear insight into price momentum and direction. BCH’s short-term trend based on its Simple Moving Average (SMA) indicates an uptrend. This positive sentiment extends to the medium-term and even the long-term, with both metrics also hinting at a continued uptrend.
- RSI (Relative Strength Index): The RSI, which gauges the magnitude of recent price changes, currently sits in a neutral zone for BCH. This suggests a balance in buying and selling pressures.
- MACD (Moving Average Convergence Divergence): MACD, an indicator used to identify changes in an asset’s momentum, has turned bullish for BCH. This suggests that bullish momentum might be building up.
- Oscillator: Currently, the oscillator for BCH is bullish, further confirming the positive momentum building in its market.
- ADX (Average Directional Index): The ADX stands weak for BCH, which often means that the strength of the trend isn’t very dominant. This can indicate sideways movement or consolidation.
Trade Setup & Outlook: What to Expect for BCH in the Coming Days?
Given the technical indicators and BCH’s recent price action, traders and investors might be in for an exciting journey. With the bullish breakout from its Channel Down pattern, there’s potential for a retest of the $250 level in the short term. If BCH maintains its momentum and receives continued positive sentiment from the market, it might even aim for the $330 resistance level. However, traders must be cautious, keeping an eye on volume and other emerging patterns that could influence price.
About BCH: A Quick Dive into Bitcoin Cash
Bitcoin Cash (BCH) was born out of a need for scalability in the Bitcoin network. Launched in August 2017, it’s a hard fork of Bitcoin aimed at increasing the block size, allowing for more transactions to be processed. It provides a faster, cheaper alternative to BTC for transactions and is renowned for its larger block sizes, making transactions quicker and fees much lower.
Wrap-Up
Bitcoin Cash, after an impressive rally driven in part by its listing on the new EDX exchange, has shown signs of a bullish resurgence. Currently trading at $212, the technical indicators, from its moving averages to the MACD, signal positive momentum, suggesting the possibility of it retesting higher resistance levels soon.
Born from a need to address Bitcoin’s scalability issues, BCH remains a significant player in the crypto space, providing faster and cheaper transactions. As the crypto landscape continues to evolve, BCH’s journey remains one to watch closely.