In today’s article, we look closely at Binance Coin (BNB), its current status, indicators, and potential trade setup. Moreover, we will provide a detailed trade setup and discuss why we believe that BNB is ready for a run toward $340.
All information in this article is based on BNB’s 1-day chart.
About Binance Coin (BNB)
Binance Coin, or BNB, is the native cryptocurrency of the Binance platform – one of the world’s largest cryptocurrency exchanges. BNB is an Ethereum-based (ERC-20) token that can be used to trade cryptocurrencies and pay fees within the Binance exchange. The token’s utility and the exchange’s popularity have resulted in its significant growth and demand since its inception.
Binance Coin — Current Status and Indicators
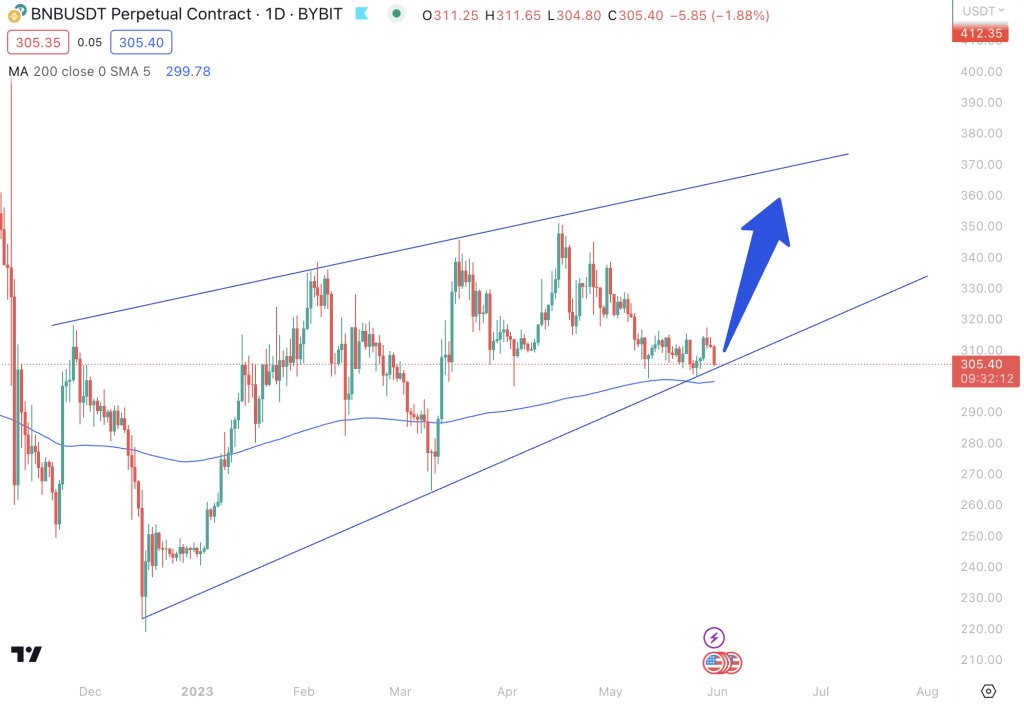
At the time of writing, BNB is trading at $305, oscillating between $280 and $350 for nearly five months. This price stability within a defined channel has provided traders with a degree of predictability, despite the inherent volatility of the cryptocurrency market.
In terms of the overall trend, BNB shows a mixed picture. The coin has been in a Short- and Medium-term downtrend, indicating recent bearish sentiment. However, the long-term outlook remains bullish, indicating that the underlying fundamentals and the broader market view of BNB remain positive.
Looking at the momentum indicators, BNB presents a mixed scenario. The MACD Line is above the MACD Signal Line, indicating bullish momentum. However, the RSI is currently below 45, which points towards a bearish momentum. This divergence suggests a potential tug-of-war between buyers and sellers, further complicating the short-term outlook.
Regarding support and resistance levels, the nearest Support Zone for BNB lies at $300, a previous resistance level. If the coin breaches this support, it could further descend toward the $260 mark. Conversely, the immediate Resistance Zone is pegged at $340. Beyond this level, the $400 mark appears to be the next significant resistance level.
Binance Coin — Trade Setup
BNB’s price pattern currently forms a Rising Wedge, which typically occurs after an uptrend and suggests a potential bearish reversal. When the price breaks the lower trendline, it is expected to trend lower. However, swing traders can trade between the converging lines before a breakout occurs.
The price has pulled back near the $300 support zone, offering an attractive swing entry point with an upside potential of $340. This setup follows a bullish breakout from a Falling Wedge pattern that saw the price reach our target of $340, only to be rejected four times so far. This level also corresponds to rejections seen in August and November last year, suggesting it’s a significant hurdle for BNB.
Summary
In conclusion, Binance Coin presents a trade setup offering potential upside, notwithstanding its recent bearish short-term momentum. While the broader market sentiment remains somewhat mixed, the coin’s support and resistance levels provide clear benchmarks for traders. Whether BNB can break the $340 resistance level and reverse its short-term downtrend remains to be seen, but it is an exciting coin to watch in the coming days.
While this analysis provides a guide, each trader needs to conduct research considering the inherent volatility and risks associated with cryptocurrency trading. After all, the cryptocurrency market is highly dynamic, and past performance does not indicate future results. Happy trading!