In the ever-evolving world of cryptocurrencies, making informed decisions about buying or selling assets is paramount.
This article will delve into an in-depth technical analysis of Binance Coin (BNB), a prominent player in the cryptocurrency market. The primary aim is to examine and predict the coin’s potential short-term and long-term price movements.
About Binance Coin (BNB)
Binance Coin (BNB) is the native cryptocurrency of the Binance exchange, one of the world’s leading digital currency trading platforms. BNB is used to pay for various fees on the Binance platform, such as trading, withdrawal, and listing fees.
Since its inception, BNB has grown in value and application, with its utility extending beyond the Binance platform, making it one of the top cryptocurrencies in the market.
Technical Analysis
In assessing the potential future price movements of BNB, we employ some well-established technical analysis indicators. We analyze these on a 4-hour chart of BNB, with our focus on the Moving Average Convergence Divergence (MACD), Relative Strength Index (RSI), and Simple Moving Average (SMA), and Exponential Moving Average (EMA).
Analyzed Indicators
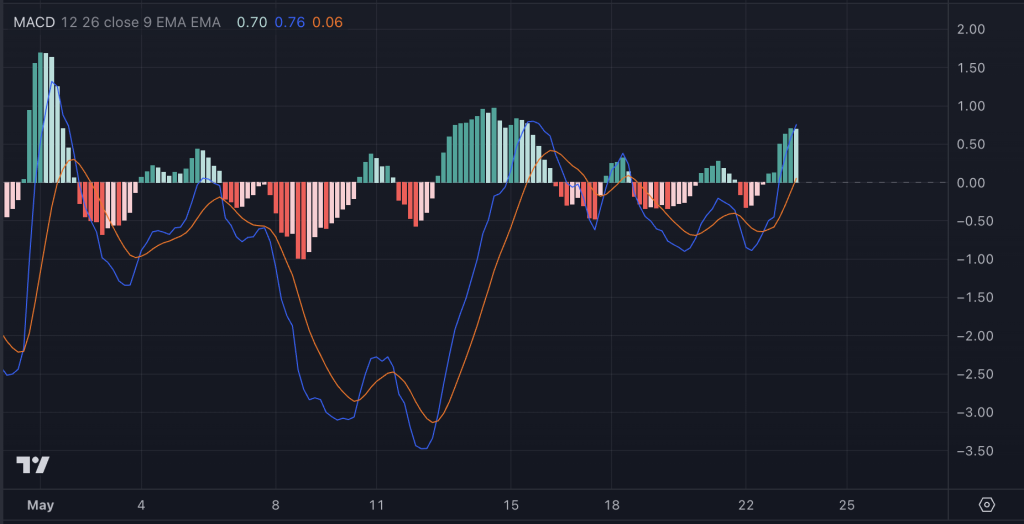
- MACD: The Moving Average Convergence Divergence is a trend-following momentum indicator that shows the relationship between two moving averages of a security’s price. As we see currently, a bullish crossover in the MACD usually signals that the shorter-term 12-period EMA has crossed above the longer-term 26-period EMA, which may indicate incoming bullish price action.
- RSI: The Relative Strength Index measures the speed and change of price movements, oscillating between zero and 100. Traditionally, the asset is considered overbought when the RSI is above 70 and oversold when it’s below 30. Our current RSI value of around 60, which falls in the neutral zone, does not provide a clear buying or selling signal on its own.
- RSI Divergence: This occurs when the price of an asset is moving in the opposite direction to its RSI. As in the present case, a bearish RSI divergence may indicate that although the price appears to be climbing or moving sideways, the underlying momentum is negative, hinting at a potential future price drop.
- SMA and EMA: The Simple Moving Average (SMA) and the Exponential Moving Average (EMA) are both smoothing indicators used to identify price trends over a specific period of time. The SMA assigns equal weight to all periods, while the EMA gives more weight to recent periods. Bearish signals from both the long-term SMA and EMA indicate that the overall trend may be downward.
Results
Combining these signals, we can infer a few key points. The bullish crossover in the MACD suggests that BNB might experience a short-term price increase, potentially reaching $325-330 from its current price of $313. This suggests a short-term buying opportunity.

However, the bearish RSI divergence and the bearish long-term SMA and EMA signals indicate a potential downward trend in the longer term. This suggests that, while BNB may increase in value in the short term, it could be a long-term sale based on these indicators.

In conclusion, our technical analysis of BNB based on MACD, RSI, and SMA/EMA indicates a potential short-term buying opportunity with an expected increase of $325-330. However, in the long term, the bearish indications from the RSI divergence, SMA, and EMA suggest a potential sell-off.
This underlines the importance of considering multiple indicators and timeframes in your trading strategy. While BNB may offer short-term gains, traders must be aware of the longer-term technicals suggesting a potential downward price movement.
However, all investments carry risks, and historical patterns do not guarantee future results. While technical analysis can provide valuable insights and predictions, combining it with fundamental analysis and closely following market news and updates is essential.
Invest wisely and never invest more than you can afford to lose. Keep an eye out for our future analysis pieces, where we will continue to bring our insights to help you navigate the complex world of cryptocurrency trading.