In this article, we dive into an insightful Bitcoin backtest of the MACD strategy throughout the year 2023. Our focus is on answering key questions:
- How did the MACD strategy perform when backtested with specific parameters on Bitcoin’s daily chart in 2023?
- What were the outcomes of each bullish and bearish MACD crossover trade?
- How do the results compare in terms of win rates and financial returns?
- Is the MACD strategy more effective than a simple buy-and-hold approach for Bitcoin trading?
Expect a straightforward, data-driven exploration that cuts through the complexities of cryptocurrency trading strategies, providing clear insights into the practical application and effectiveness of the MACD strategy in Bitcoin trading for the year 2023.
Bitcoin Backtest — The Fundamentals
Before we take a closer look at the Bitcoin backtest results, we must understand the backtest conditions we applied. First of all, our Bitcoin backtests focused on trading every bullish and bearish MACD crossover on Bitcoin’s daily chart (we will explain what this means in a second).
We simulated these trades with an initial capital of $1,000, a take profit of 4%, a stop loss of 1%, and a 2x leverage. This approach allowed us to rigorously backtest the efficacy of this strategy under specific, controlled conditions. Moreover, it is important to mention that our Bitcoin backtest was based on the daily chart. Therefore, the number of trades is quite limited.
Understanding the Moving Average Convergence Divergence (MACD) and the underlying trade signals of our Bitcoin Backtest
The Moving Average Convergence Divergence (MACD) is a widely used technical indicator in trading that helps identify trends and momentum in an asset’s price. Essentially, it involves two key components: the MACD line, which is the difference between the 12-day and 26-day Exponential Moving Averages (EMAs) of the asset, and the signal line, usually a 9-day EMA of the MACD line itself.
As we already mentioned, our Bitcoin backtests relied on two trading signals:
- Bullish Crossovers occur when the MACD line crosses above the signal line, indicating potential buying opportunities, which suggests an upward momentum in the asset’s price. Traders often view this as a sign that the asset’s price might start an upward trend, making it a favorable time to enter a long position.
- Conversely, Bearish Crossovers happen when the MACD line crosses below the signal line, signaling potential selling opportunities or a time to sell short. This crossover is typically interpreted as a sign of downward price momentum, suggesting that the asset’s price might be heading into a downtrend.
Want more Backtest results? Check out this article: Crypto Backtest: The Most Extensive Analysis (15+ Trading Strategies)
Bitcoin MACD Trading Strategy: Overall Backtet Results
Alright, it’s time to get to business and have a look at the results of our Bitcoin backtest. In this chapter, we will provide unbiased results, whereas the next chapter will provide our assessment of the trading strategies.
MACD Bullish Crossover — Results
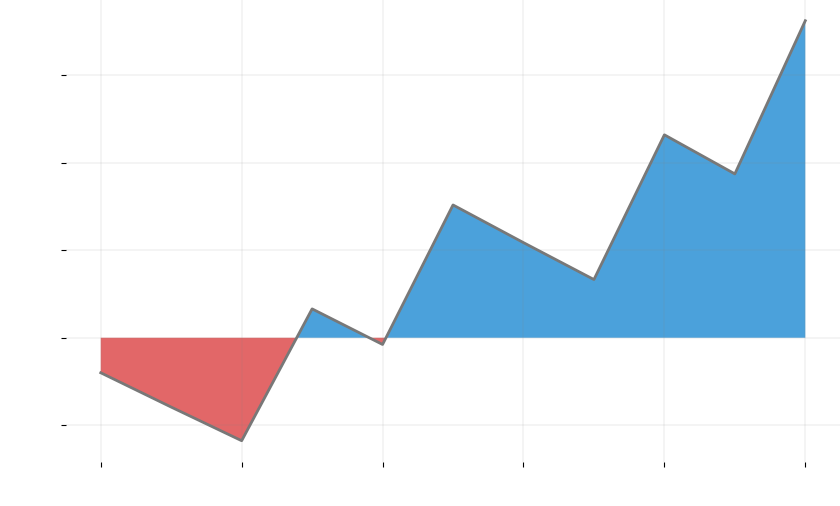
Strictly trading the bullish MACD crossovers would have made you 18% when using a 2x leverage. Out of eleven trades, the signals were successful in 36% only.
| Overall Number of Trades | 11 |
| Win Trades | 4 |
| Win Rate | 36% |
| Max. Drawdown | $58 |
| Final Win/Loss | +18% |
| Final Amount | $1.181 |

MACD Bearish Crossover — Results
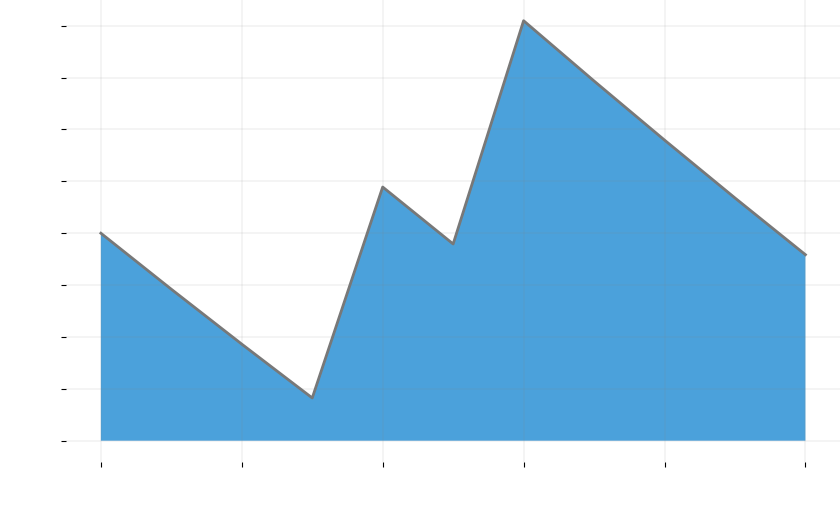
Strictly trading the bearish MACD crossovers would have made you 7.2% when using a 2x leverage. Out of eleven trades, only three signals showed a successful result.
| Overall Number of Trades | 11 |
| Win Trades | 3 |
| Win Rate | 27% |
| Max. Drawdown | $0 |
| Final Win/Loss | +7.2% |
| Final Amount | $1.071 |

Bitcoin MACD Strategy Backtest — A Detailed (And Critical) Assessment
While our analysis of the MACD strategy for Bitcoin in 2023 yielded positive returns, a deeper dive into the results reveals several concerning aspects. This chapter critically assesses these results, highlighting the less-than-optimal performance of the strategy when viewed from different angles.
Devastating Win Rate
When looking at Bitcoin backtest results, it is obvious that the win rates for both bullish and bearish crossovers are notably low. With a win rate of approximately 36.36% for bullish crossovers and 27.27% for bearish crossovers, the strategy falls short of expectations. In the volatile and unpredictable realm of cryptocurrency trading, such a win rate is somewhat devastating, particularly for a currency as prominent as Bitcoin. This low win rate signals a significant level of risk and unpredictability associated with relying solely on MACD crossovers for trading decisions.
Impact of Leverage and Number of Trades
The use of leverage, in this case, a factor of 2, and the limited number of trades (11 for each crossover type) further accentuate the strategy’s shortcomings. While leverage can amplify gains, it equally magnifies losses, especially in a market as volatile as Bitcoin’s. The low number of trades, coupled with the strategy’s inconsistent performance, suggests that the strategy might not adequately capture the market’s opportunities. Consequently, the final results, though positive, are not optimal when considering the potential risks and opportunities lost during the trading period.
MACD Strategy vs. Buy-and-Hold Strategy
Perhaps the most revealing aspect of this analysis comes from comparing these results with a simple buy-and-hold strategy. A buy-and-hold approach, especially in a market with an overall positive trend, as seen with Bitcoin over the years, often yields substantial returns with minimal effort and risk exposure.
In contrast, our MACD strategy, despite being active and presumably more responsive to market changes, failed to outperform this passive strategy significantly.
Given the effort, time, and risk management required for active trading, the results of the MACD strategy for Bitcoin in 2023 are underwhelming. This observation is critical for traders who might be considering similar strategies. It underscores the importance of following technical indicators in isolation and integrating them into a broader, more comprehensive trading strategy. It also highlights the need for continuous backtesting and adaptation of strategies to align with the dynamic nature of the cryptocurrency markets.
Bitcoin MACD Backtest — A Summary
In conclusion, while the MACD strategy did yield positive results, its performance was not optimal, especially when considering the associated risks and the potential gains that a simpler strategy could have achieved. This analysis serves as a reminder that in trading, especially in the complex world of cryptocurrencies, simplicity often trumps complexity and risk management is key.
About CryptoKnowledge & the CryptoKnowledge App
At CryptoKnowledge, we pride ourselves on providing top-notch crypto data and tools. Our app is accessible on both the App Store and Play Store, featuring almost 200 crypto tokens and an array of functionalities like crypto signals, screeners, AI-based forecasts, and much more. Discover how we can elevate your trading experience, and download the app now!