The Current Status of BCH – A Game of Bears
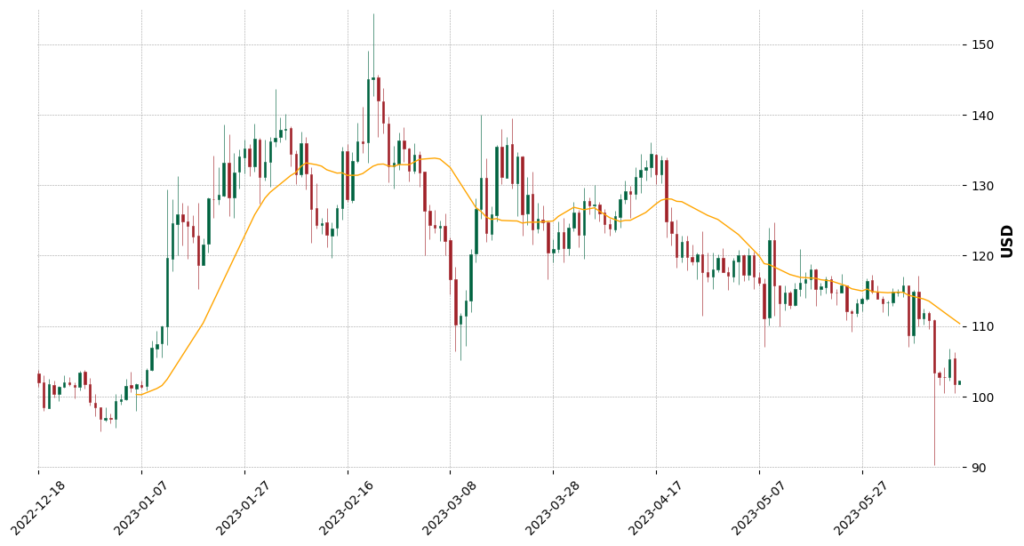
Currently, Bitcoin Cash (BCH) is valued at $102.54. In the past 24 hours, it has experienced a price alteration of 0.82%, indicating some market volatility. The trade setup for BCH is currently on a bearish note with a breakout from a Descending Triangle pattern. This has resulted in a dip below the $110 support level, confirming a market downtrend.
The Descending Triangle pattern has historically signaled the likely direction of price movement. In this case, we’ve witnessed a breakout in the direction of the existing bearish trend. A significant number of traders would usually take a position once the price action breaks through the lower boundary of the triangle with an upsurge in volume. This is typically when we could expect the price to decrease to an extent equivalent to the broadest segment of the triangle.
In this context, there’s a chance that the price might revisit the $95 support level, which was last seen towards the end of 2022. The nearest support zone is set at $95, whereas resistance zones are currently pegged at $110, $120, and a range between $140-$150. The $110 resistance level is notably the previous support level, underscoring BCH’s market dynamics shifts.
Bitcoin Cash (BCH): Technical Indicators – Numbers Tell the Tale
Shifting our focus to technical indicators, we must evaluate the trends based on moving averages. The Short Term, Medium Term, and Long Term Simple Moving Averages (SMA) all point to a downtrend, signifying a bearish market for BCH.
The Relative Strength Index (RSI), a momentum oscillator that measures the speed and change of price movements, currently stands neutral for BCH. This means the market is not showing any clear signs of oversold or overbought.
The Moving Average Convergence Divergence (MACD), a trend-following momentum indicator, is bearish. This hints that the short-term momentum for BCH is slower than its longer-term momentum, indicating a potential downward price movement.
In contrast to the MACD, the oscillator is bullish. An oscillator is a technical analysis indicator that varies over time within a band, providing insights into market momentum, direction, strength, and volatility. A bullish oscillator suggests positive price momentum and could be an early sign of a market turnaround.
Finally, the Average Directional Index (ADX), which measures the strength of a trend irrespective of its direction, is weak. This shows that the current bearish trend might not be as strong as it appears, leaving room for potential fluctuations.
Bitcoin Cash (BTC): Trade Setup & Outlook – Bracing for a Bearish Run
In the short term, the market outlook for BCH remains bearish, as confirmed by the Descending Triangle pattern and the bearish MACD. This suggests that we may see the price of BCH continue to drop, possibly revisiting the $95 support level.
Despite the bearish indicators, the bullish oscillator signals the potential for an upward price swing. This indicates that although the market currently trends lower, a reversal is not off the table. However, for any significant bullish reversal to occur, BCH must break through the nearest resistance at $110 with substantial volume, a move that appears challenging in the current setup.
About Bitcoin Cash (BCH)
Bitcoin Cash (BCH) is a cryptocurrency that was forked from Bitcoin in 2017. It was created to address Bitcoin’s scalability issues and aims to provide a faster, more efficient payment system for daily transactions. BCH has often been considered the “cash version” of Bitcoin, offering quicker transfers and lower fees, making it more suitable for small, everyday transactions.
Wrap-Up
In summary, BCH is currently grappling with a bearish market. The significant downtrend, as depicted by the Descending Triangle pattern and confirmed by the bearish MACD, suggests the price could revisit the $95 support level. However, the bullish oscillator provides a glimmer of hope for an impending market turnaround.
The future of BCH heavily relies on its ability to break through its resistance levels with substantial volume, a task that seems daunting in the current market setup. Yet, the ever-volatile world of cryptocurrency is known for its unpredictability, making the future of BCH an intriguing aspect to watch.