
Current Status: Bitcoin Navigates the Storm
Bitcoin (BTC), the pioneering and most influential cryptocurrency, trades at a pivotal $30,055. Over the last 24 hours, it has seen a 1.44% dip. However, this minor setback doesn’t overshadow the significant strides it has made recently.
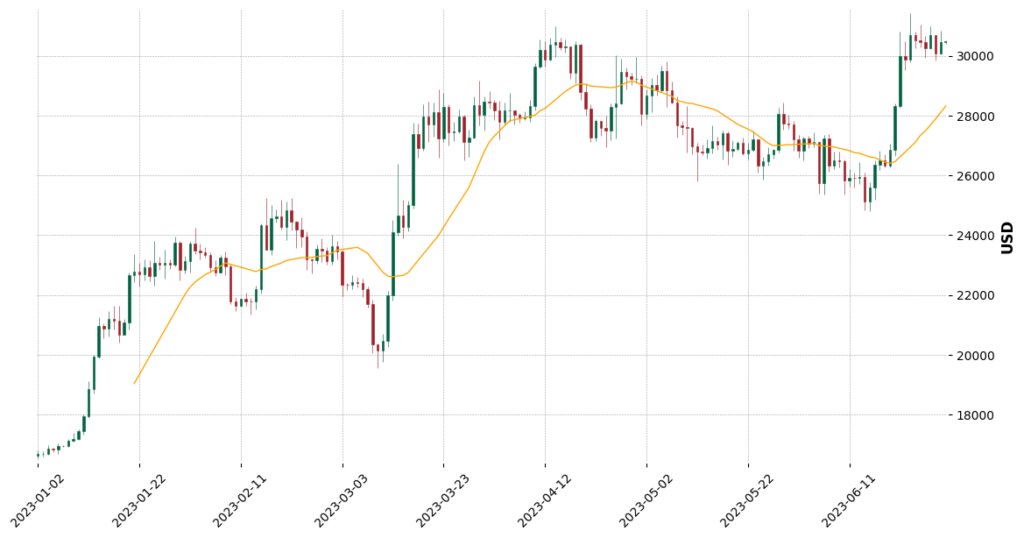
Following a bullish breakout from the Channel Down pattern and a surge above the $28K resistance mark, the price of BTC resumed its uptrend, reaching our target zone of $30K-$32K resistance.
At this juncture, investors and market watchers eagerly anticipate the next move – whether it breaks above the $32K mark to signal the resumption of the uptrend or pulls back near the $28K support level, offering an ideal swing entry point in the uptrend.
Bitcoin (BTC): Technical Indicators
Bitcoin’s market movements are usually analyzed using a variety of technical indicators, each providing a unique perspective on the token’s performance.
- Short, Medium, and Long-Term SMA Trends: The short, medium, and long-term trends, based on the Simple Moving Average (SMA), suggest an uptrend.
- RSI Overbought: The Relative Strength Index (RSI), a momentum oscillator, suggests that Bitcoin is in a neutral position.
- MACD Bullish: However, the Moving Average Convergence Divergence (MACD), a trend-following momentum indicator, suggests a bullish trend for Bitcoin. This means that despite short-term fluctuations, the overall market sentiment remains positive.
- Oscillator Bullish: Another momentum indicator, the Oscillator, echoes the MACD’s sentiment and indicates a bullish trend. This suggests that Bitcoin has strong upward momentum.
- ADX Strong: The Average Directional Index (ADX) signifies a strong trend. This implies that Bitcoin’s current uptrend is strong and likely to continue.
Bitcoin (BTC) Trade Setup & Outlook
Based on the predominantly bullish indicators, the short-term price development of Bitcoin seems to be poised for further increase. The token is treading within the $30K-$32K resistance zone, and its next significant move will likely set the tone for its short-term outlook.
If the price breaks above the $32K resistance level, it could signal a resumption of the uptrend, potentially leading to further gains.
Conversely, a pullback near the $28K support level could provide an excellent swing entry point for traders, with the anticipation of the resumption of the uptrend following the pullback.
Wrap-Up
In summary, Bitcoin is currently navigating the $30K-$32K resistance zone. Various technical indicators suggest a bullish continuation, with the potential for a resumption of the uptrend. However, there is a chance of a short-term pullback.
About BTC: The Pioneer of Cryptocurrencies
Bitcoin (BTC), the first-ever cryptocurrency, is a digital token that operates on a decentralized peer-to-peer network. Launched in 2009 by an anonymous entity known as Satoshi Nakamoto, Bitcoin has sparked a revolution in the financial industry by providing a decentralized, transparent, and secure method of transferring value over the internet. Its value and influence in the market are unrivaled, often acting as a barometer for the overall health of the cryptocurrency market.