The Current State of BNB – Consolidation and Opportunities
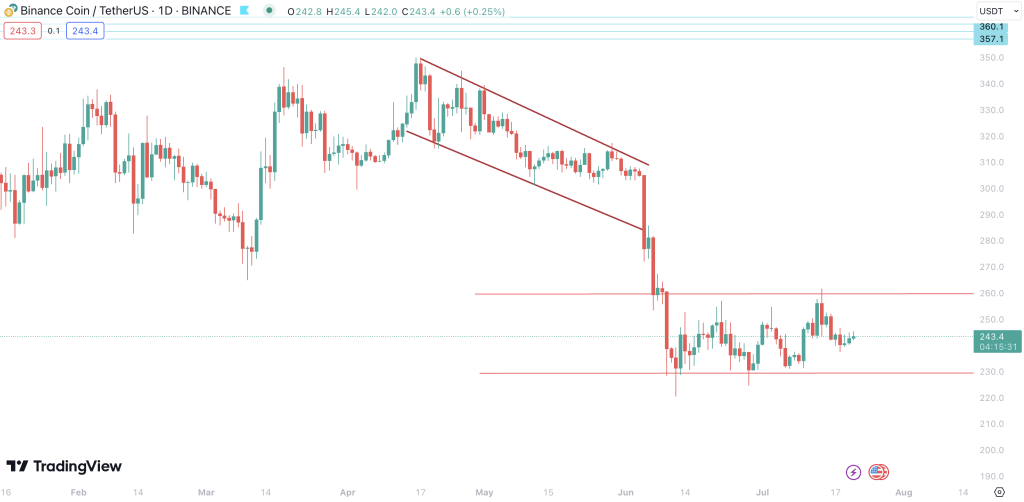
BNB, the native cryptocurrency of the Binance exchange, is currently trading at $243, a slight uptick of 0.25% in the last 24 hours. This price change might seem insignificant, but it contributes to the ongoing narrative of BNB’s price behavior.
Since the significant drawdown in June, the BNB price has established a firm sideways channel, with boundaries oscillating between $220 and $260. This range-bound movement signifies market consolidation and presents a lucrative swing trading opportunity.
For traders familiar with range trading, this sideways channel signifies a potential profit margin of up to 17% – providing they can execute entries near the $220 support and exits near the $260 resistance. While trading within this range, the current status of BNB reminds us of the adage, “Buy low, sell high.”
A Deeper Look at BNB’s Technical Indicators
Before making any trading decisions, it’s essential to understand the underlying technical indicators that are influencing BNB’s price.
The moving averages (MA) reveal a mix of trends. The short and medium-term moving averages point towards an uptrend, suggesting bullish momentum in the near to medium-term. On the other hand, the long-term moving average shows a downtrend, signifying bearish pressure over extended periods.
The Relative Strength Index (RSI), an indicator used to identify overbought or oversold conditions, currently indicates neutral for BNB. This tells us that the market is neither overbought nor oversold – an expected scenario in a range-bound market.
Meanwhile, the MACD (Moving Average Convergence Divergence) shows a bearish trend. Usually, a bearish MACD could indicate selling pressure; however, in the context of the current sideways market, it might represent potential buying opportunities near the lower range boundary.
Further corroborating the bearish sentiment is the Ultimate Oscillator, which also points to bearish conditions. Finally, the ADX (Average Directional Index), which measures trend strength, indicates weak trend strength. This aligns with the ongoing sideways movement of BNB.
The Trading Setup and Outlook for BNB
Given the range-bound behavior highlighted by the technical indicators, a trading setup leveraging the sideways channel presents the most strategic outlook.
Traders should ideally look to enter long positions near the $220 support level and exit or take profit near the $260 resistance level. Setting appropriate stop-loss levels just below the $220 support is important to mitigate potential downside risk.
This strategy, while simple, can yield a potential profit of up to 17% per completed swing within the channel. However, should BNB break out of this channel, traders should reassess the market conditions and devise new strategies based on the emerging trend.
About BNB
BNB, or Binance Coin, is more than just another cryptocurrency. It’s the native coin of the Binance exchange, one of the largest and most successful cryptocurrency exchanges globally. Initially, BNB was an ERC-20 token that operated on the Ethereum blockchain but has since migrated to Binance’s proprietary blockchain, the Binance Chain. BNB plays a crucial role in the Binance ecosystem, offering utilities like discounted trading fees, participation in token sales, and more.
Summing Up The BNB Market Status and Outlook
In conclusion, BNB presents an intriguing case of a high-profile cryptocurrency trading in a steady sideways channel. This range-bound behavior and mixed technical indicators open up a window of opportunity for swing traders. Trading within this channel could potentially yield up to a 17% profit.
While the indicators reveal a mixed bag of bullish and bearish signals, their interpretation within the context of a sideways market provides valuable trading insights. As always, traders should monitor the market for any sudden changes that might disrupt the prevailing status quo.
This trading opportunity was detected using our crypto screener, a tool that can give traders an edge by pinpointing opportunities based on technical indicators and market conditions. The screener’s advanced filters helped us isolate BNB’s sideways channel pattern and evaluate its profit potential. So stay tuned, and let our crypto screener guide you to your next trading opportunity!
Please note: The information presented in this article is for educational purposes only and does not constitute financial advice. Always do your own research before making any investment decisions.