
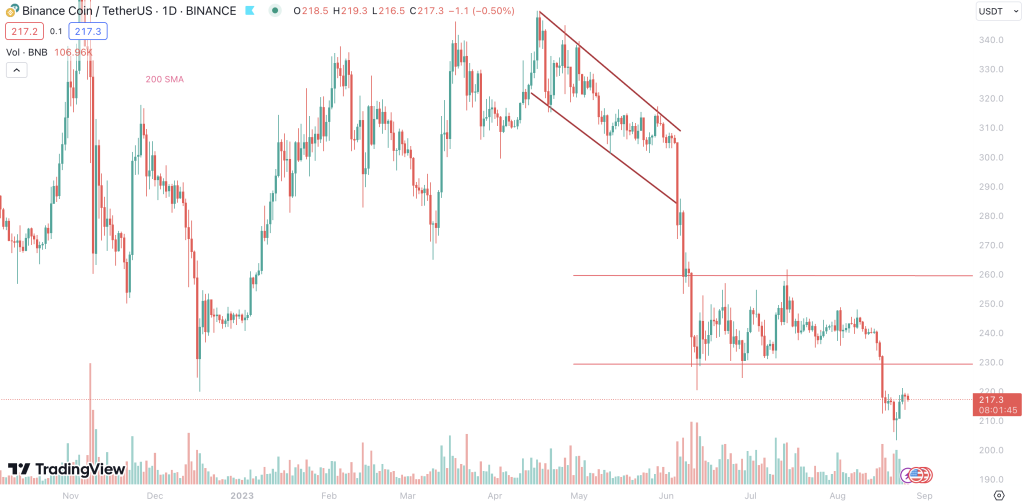
BNB has been navigating turbulent waters. Currently trading at $217, the token has experienced a price decline of 0.5% within the last 24 hours. While such daily fluctuations may be typical in the volatile cryptocurrency landscape, looking beyond mere daily shifts is essential. BNB’s recent bearish breakout from its Ascending Triangle pattern is a cause for concern.
This pattern break signifies a significant move downwards, as the price has slid beneath the crucial $220 support threshold. Historically, this specific level acted as a bastion for BNB, holding firm in June and again in December 2022. This recent dip brought the token precariously close to the $200 support zone, reaching lows of $203. Although a slight bounce occurred when the RSI indicated a heavily oversold state, the overarching trend for BNB leans bearishly.
Technical Indicators: Deciphering BNB’s Path
To grasp BNB’s current trajectory, understanding key technical indicators is essential:
- Trends based on moving average: BNB exhibits a Short Term Downtrend with its SMA. The Medium Term and Long Term SMA, too manifest a Downtrend. This aligns with the token’s recent descent, as its moving averages across timeframes reflect a bearish narrative.
- RSI (Relative Strength Index): BNB’s RSI is currently neutral. This indicates that the token isn’t in an overtly sold or bought state, giving it potential space to move in either direction.
- MACD (Moving Average Convergence Divergence): BNB displays a bearish MACD, suggesting that the downward momentum could persist or even intensify.
- Oscillator: Oscillating metrics for BNB are bearish, further solidifying the perspective that downward forces might continue to dominate.
- ADX (Average Directional Index): With an ADX categorizing the strength as weak, the current trend (even if bearish) isn’t showing formidable strength, hinting at possible trend exhaustion or reversal.
Trade Setup & Outlook: Anticipating BNB’s Moves
Given the outlined indicators, BNB’s short-term prospects look challenging. With its moving averages painting a bearish narrative across various timeframes and the MACD and oscillator metrics agreeing, it’s hard to deny the downward momentum.
However, the weak ADX implies this bearish momentum might be running out of steam. Traders should be vigilant, especially around the $200 support mark. If BNB can hold above this zone, it might provide a foundation for a potential rebound. Conversely, breaking below could see further downward spirals. For now, caution and close monitoring are advised.
About BNB: A Behemoth in the Crypto Landscape
BNB, or Binance Coin, isn’t just another token in the vast crypto world. Originating from the Binance platform, one of the largest cryptocurrency exchanges globally, BNB initially functioned as a utility token offering trading discounts.
However, its scope expanded massively. Now pivotal to Binance Smart Chain operations, BNB is integral to multiple blockchain transactions and decentralized applications.
Wrap-Up: BNB’s Turning Tides?
BNB is currently in a challenging phase, underscored by its break below the significant $220 mark. Various technical indicators, like moving averages, RSI, and MACD, predominantly suggest a bearish mood. However, a weak ADX suggests this trend might not be relentless.
While the short-term outlook calls for caution and close monitoring, BNB’s foundational strength as a pivotal player in the crypto world can’t be overlooked. The coming days will determine if this giant can weather the storm and reclaim its prior glory.