Introduction
Bollinger Bands are a set of trendlines plotted two standard deviations away (both positive and negative) from a simple moving average (SMA) of a security’s price. The technique was crafted by John Bollinger, aiming to determine when an asset is possibly oversold or overbought.
Main Components:
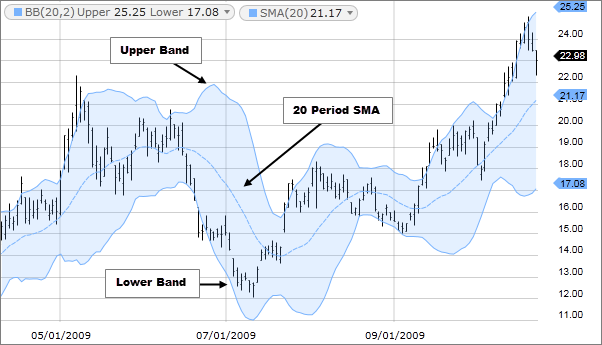
- Middle Band: Simple Moving Average (typically over 20 days).
- Upper Band: Two standard deviations above the middle band.
- Lower Band: Two standard deviations below the middle band.
Signals and Interpretations:
- Overbought Indicator: When price consistently touches the upper band.
- Oversold Indicator: When price consistently touches the lower band.
- Squeeze: A period when the bands come close together, indicating low volatility. This might hint at a potential surge in volatility.
- Breakouts: Significant when price goes above or below the bands. However, they don’t specify the direction of the future price movement.
Limitations of Bollinger Bands
While Bollinger Bands offer a wealth of information about price trends and potential buy/sell signals, they shouldn’t be used in isolation. It’s not a one-size-fits-all trading tool. The standard parameters, such as the 20-day SMA and 2 standard deviations, might not be suitable for every market condition or individual trading strategy. Furthermore, since it gives equal weightage to both new and old data, the influence of recent market events might get diluted.
Complementary Indicators:
- Relative Strength Indicator (RSI)
- BandWidth Indicator
Real-Life Applicability
Traders often use Bollinger Bands® to anticipate significant price movements. For instance, a squeeze in the bands can alert day traders to potential breakout scenarios, prompting them to adjust their positions. Swing traders might use the bands to identify potential reversal points in the market. By observing where the price is in relation to the bands, investors can also make informed decisions about asset allocation, adjusting their portfolio based on perceived market volatility.
Accuracy
When using Bollinger Bands, their design inherently incorporates two standard deviations around an SMA. This configuration means that, statistically, we can anticipate the observed price action to remain within these bands about 95% of the time. Such precision is part of what makes Bollinger Bands a trusted tool for many traders seeking to gauge market volatility and potential price movements.
Conclusion
Bollinger Bands® assist traders in gauging the potential overbought or oversold status of a stock, offering clues on entry and exit points. It’s particularly effective in currency trading. Purchasing when stock prices dip below the lower Bollinger Band can be profitable, capitalizing on oversold scenarios and earning when the stock price rebounds. As with all tools and techniques in the financial world, it’s essential to continually educate oneself.
Trade Confidently with CryptoKnowledge
Equipped with the understanding of Bollinger Bands, you’re poised to decipher its nuances on our CryptoKnowledge platform. Our dedication lies in empowering traders with the essential knowledge and tools to confidently traverse the complex realm of cryptocurrency trading. We hope this article has enhanced your analytical prowess. Here’s to your trading success with CryptoKnowledge!