Cryptocurrency markets, in their essence, are a treasure trove of opportunities for seasoned traders and new enthusiasts alike. The rapid pace, high volatility, and infinite possibilities create a dynamic ecosystem that beckons those ready to dive deep into the nitty-gritty of the trade.
In this analysis, we’ll explore Binance Coin (BNB), one of the intriguing assets in the crypto space. We’ll journey through its current market status, derive insights from key technical indicators, unravel a potential trade setup, and summarize our findings.
About BNB
Binance Coin, widely known as BNB, is a native token of the Binance exchange, one of the world’s leading cryptocurrency exchanges. It initially operated on the Ethereum network but migrated to its proprietary Binance Chain in 2019.
BNB plays a significant role in the Binance ecosystem, offering utility as a mode of payment for transaction fees, participating in token sales, and more. Over the years, BNB has secured a spot in the top echelon of cryptocurrencies by market capitalization thanks to its consistent performance and the growth of the Binance platform.
BNB — Current Status
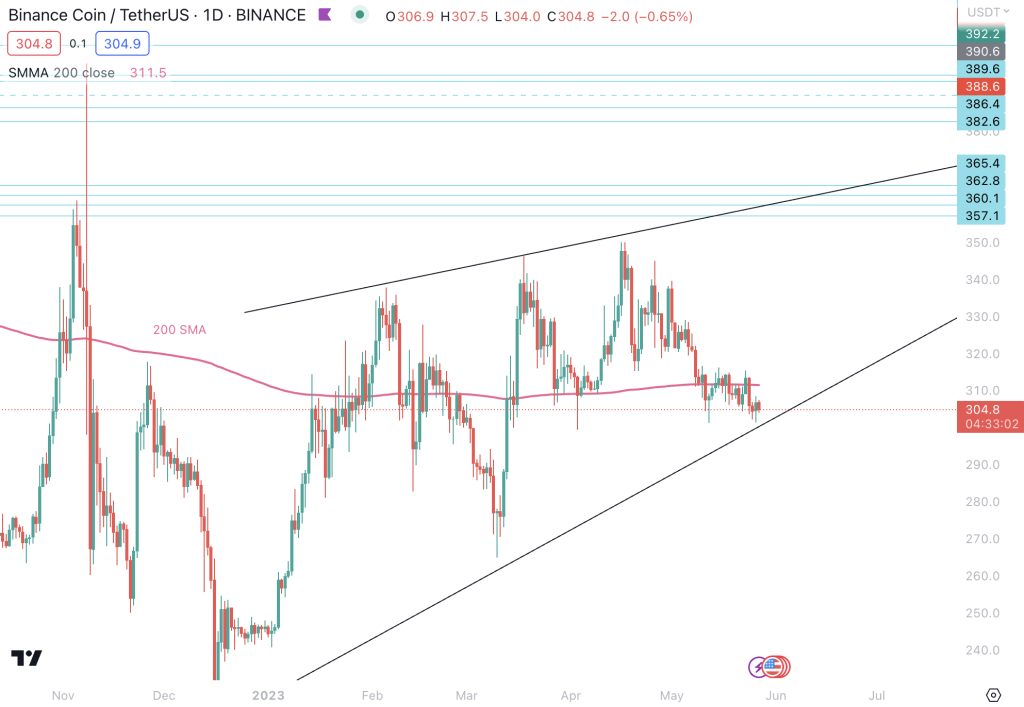
Currently, BNB is trading in a Rising Wedge pattern and has pulled back near the critical $300 support zone. Despite a short- and medium-term downtrend, BNB is on an uptrend from a long-term perspective.
The $300 zone may present an attractive swing entry, given its strong upside potential of $340.
Previously, BNB displayed a bullish breakout from a Falling Wedge pattern, enabling it to reach our target of $340. However, this level has proven to be a robust resistance zone, with the price getting rejected four times thus far. This resistance is notable, as BNB encountered similar rejections at this level back in August and November last year.
Stochastic RSI Shows Bullish Signs
However, the stochastic RSI – another key momentum indicator that contrasts the closing price of BNB against its price range over a set period – tells a different story. Currently leaning towards bullishness, the stochastic RSI suggests that BNB’s price might be nearing the bottom of its range and could potentially gear up for an upward swing. This indication of bullish momentum breathes a hint of optimism into BNB’s current situation.
ADX, MOM & MACD Remain Bearish
On the flip side, a note of caution reverberates from other pivotal indicators. The Average Directional Index (ADX), an indicator that measures the strength of a prevailing trend regardless of its direction, presently signals bearishness. This suggests that the current downtrend in BNB’s price might still have strength left to persist further.
Simultaneously, the Momentum (MOM) indicator, which evaluates the speed at which the price of an asset changes, also leans bearish. This echoes the sentiment that the downward price action might continue in the short to medium term.
Adding to these signals, the Moving Average Convergence Divergence (MACD), a trend-following momentum indicator, offers another bearish insight. The MACD illustrates the relationship between two moving averages of BNB’s price, and its bearish outlook serves to underscore the current negative market sentiment further.
BNB — Potential Trade Setup
In this current market scenario, BNB’s technical indicators reveal a mosaic of bullish and bearish signals, painting a nuanced picture that demands careful interpretation. At this juncture, the Relative Strength Index (RSI) – a potent tool employed by traders to gauge the magnitude and speed of price changes – is treading in neutral territory. It suggests a momentary equilibrium between buying and selling pressures, making it tricky to predict the coin’s immediate direction.
Given this complex market environment, traders should approach BNB with heightened scrutiny and vigilance. Monitoring the price movement for any subtle shifts that may hint at a potential trend reversal is imperative.
A prudent trade setup would involve entering a swing trade close to the $300 support zone. However, such a move should only be executed after careful confirmation of a bullish reversal, with an aim to capitalize on the potential upside towards the $340 mark.
Patience, analysis, and strategic timing will be the cornerstone of making this trade successful.
Summary
To summarize, BNB is in a fascinating market position. While currently in a rising wedge pattern and exhibiting potential for a profitable swing trade, the price has a history of rejection around the $340 mark, suggesting considerable resistance at this level.
The mixture of bearish and bullish signals from the technical indicators reiterates the need for vigilance and a strategy poised to respond swiftly to market shifts. Traders should heed the call for cautious optimism, leveraging the potential bullish swing setup while keeping an eye on key resistance levels.
Remember that the cryptocurrency market’s inherent volatility necessitates an investment strategy that aligns with your risk tolerance. Stay tuned for updates as we continue to track BNB’s journey in the dynamic world of crypto trading.
[Disclaimer: The content in this blog post is for informational purposes only and not intended as financial or investment advice. Cryptocurrency investments carry a high level of risk, and it is possible to lose the entire investment.]