ATOM On the Cusp of a Breakout
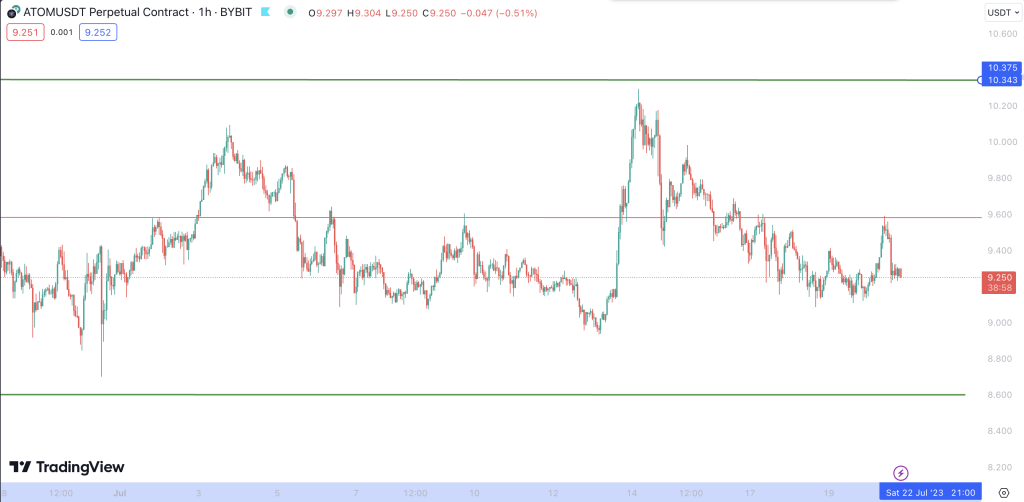
ATOM trades at a price of $9.28, displaying a minimal 1% change in the last 24 hours. Despite being in a bearish trench, ATOM has shown commendable resilience. The token experienced a significant dip, dropping to lows of $7.00. However, the market did not allow it to languish at this level, exhibiting a quick recovery as it bounced back from the oversold territory indicated by an RSI below 30.
ATOM is operating within a Channel Up pattern, signifying that we’re waiting for an impending breakout. Ideally, this breakout would be above the $11 level, corresponding to the 200-day moving average (MA). For trend traders, the essential signpost to watch out for is the $10.50 resistance level. If the price ascends beyond this point and breaks above the 200-day MA ($11.30), it would signify the cessation of the current downtrend.
Technical Indicators: Dissecting ATOM’s Market Behavior
Diving into the technical indicators provides a clearer perspective on ATOM’s recent price movements. Trends based on the moving average underscore the bearish scenario. Both short-term and medium-term trends indicated by the Simple Moving Average (SMA) are in a downtrend, mirroring the long-term trend’s downtrend.
While the Relative Strength Index (RSI) is neutral, the Moving Average Convergence Divergence (MACD) indicator paints a brighter picture, reflecting a bullish signal. This divergence between the price trend and MACD hints at a potential trend reversal in the offing.
However, the Ultimate Oscillator leans bearish, indicating that selling pressure has recently dominated. Contrasting with this is the ADX (Average Directional Index), which is strong, indicating a robust, bearish trend.
Trade Setup & Outlook: Navigating the ATOM Market
Based on the presented indicators and patterns, the immediate term might continue to test the resilience of ATOM investors. However, the bearish momentum may be waning as the bullish MACD suggests. We might witness an encouraging trend reversal if the price can convincingly break above the $10.50 resistance level and the 200-day MA at $11.30.
bout ATOM: The Cosmos Network’s Native Token
ATOM is the native utility token of the Cosmos Network, a decentralized network of independent, scalable, and interoperable blockchains. It facilitates security, governance, and interoperability in the network and allows holders to participate in key decisions pertaining to the network’s upgrades and changes.
Summary: ATOM Poised for a Potential Breakout
In summary, ATOM has been battling with a bearish trend, but current indicators hint at a possible shift. The token’s price resilience and a bullish MACD set up the potential for a promising breakout, targeting levels beyond the $11.30 mark. It is a critical period for ATOM, and trend traders and investors should watch the $10.50 resistance and 200-day MA levels. The ATOM journey reiterates the dynamism of the crypto market and the potential rewards for those who navigate its waves strategically.