Chainlink Overview
Analyzed Period
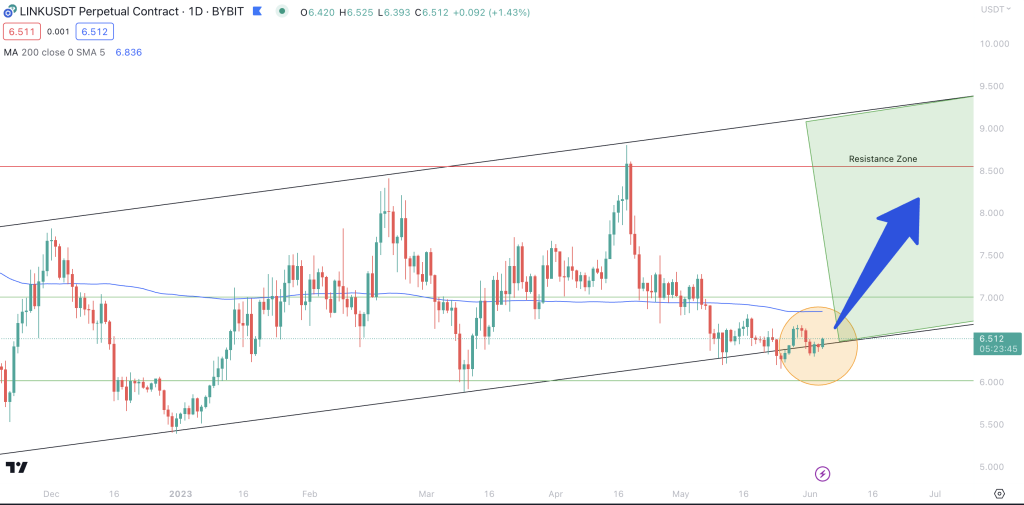
Daily Chart
Outlook
Bullish
Profit Potential
40%
Market Status and Overview
At a current trading value of $6.50, Chainlink (LINK) has been through a rough patch, witnessing a significant drop of 25% since the end of April. Nonetheless, the latest chart patterns shine a ray of hope for crypto. The LINK price showcases an emerging Channel Up pattern on the daily chart.
Within this pattern, traders anticipating the price will maintain its course within the channel may consider initiating trades when the price fluctuates within the pattern’s trendlines. Moreover, a decisive breakout from the channel’s upper or lower boundaries could result in rapid price movements in the direction of the breakout.
Significantly, a rally to the upper limit of the channel, which resides between $9 and $9.25, could potentially ignite a 40% surge in LINK’s value. Even a conservative scenario, with LINK ascending to the April resistance level of $8.50, points to a substantial 30% pump.
In-Depth Indicator Analysis
From a broader perspective, LINK is presently engulfed in a downtrend across all timeframes—short, medium, and long-term.
A detailed look at the momentum indicators reveals a mixed bag. The Moving Average Convergence Divergence (MACD) line surpassing the MACD signal line signals bullishness. However, the Relative Strength Index (RSI) hovering around the neutral 50 mark, coupled with declining MACD histogram bars, suggests weakening momentum.
Examining support and resistance zones provides further insights. The closest support for LINK is at the $6.00 level, followed by $5.50. On the other hand, the resistance hurdles LINK needs to overcome are $7.00, a previous support zone, followed by the April resistance level of $8.50.
Trading Strategy and Market Outlook
Given that LINK is presently navigating within a Channel Up pattern, swing traders could exploit the fluctuating price within this pattern. Buying near the channel’s support and selling near its resistance trendline can potentially lead to profitable trades. Considering that LINK’s price is currently hovering around the channel’s lower boundary, now might be an opportune time to enter the market.
As with any trading strategy, a well-placed stop loss is crucial to mitigate potential losses. In this case, the stop loss should be placed marginally below the channel’s lower boundary.
Looking ahead, profit targets to consider include $7.2, $7.6, $8.5, and the optimal level of $9.25.
However, it’s crucial to remember that the crypto market is volatile and unpredictable. Therefore, continuously monitoring market conditions and adjusting trading strategies accordingly is essential.
About Chainlink (LINK)
Chainlink is a decentralized oracle network that connects smart contracts with real-world data, enabling them to interact with external systems.
As a pioneer in the blockchain industry, Chainlink aims to bridge the gap between blockchain technology and existing infrastructures by providing reliable, tamper-proof inputs and outputs for complex smart contracts on any blockchain.
LINK is the native utility token of the Chainlink ecosystem, primarily used to pay node operators for retrieving data for smart contracts, among other uses.
Conclusion
Despite Chainlink’s recent downward trajectory, the emergence of a Channel Up pattern and the potential for a significant price rally provide reasons for cautious optimism. However, careful market analysis and risk management remain essential in navigating the unpredictable crypto market landscape.