FTT: A Dynamic Outlook Amidst Mixed Signals
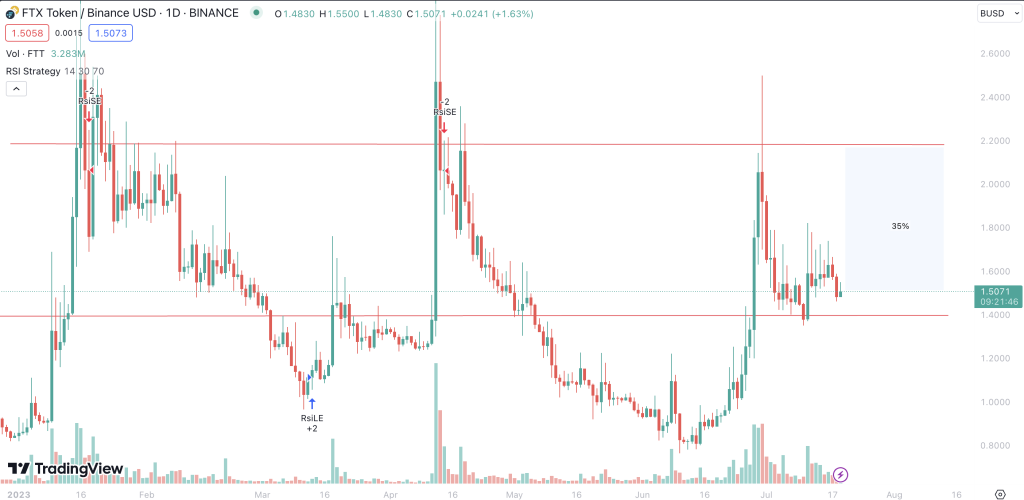
FTT currently trades at a rate of $1.51, with a notable price change of 2.5% within the last 24 hours. The market has been a rollercoaster for most digital currencies, and FTT has not been spared. However, it’s a brave new dawn for the token. Despite mixed technical indicators, we believe FTT is about to shake off its bearish tendencies, exhibiting an exciting flip scenario that’s bound to leave investors grinning.
FTT’s historical performance has shown resilience, bouncing back beautifully from its long-term support pegged at $1.40. The token’s performance gives investors a promising hint that it’s poised to challenge the long-term resistance at $2-$2.20. If this move materializes, we’re looking at a potential surge of up to 35%, similar to the runs witnessed in January, April, and June.
Unraveling the Complexities: A Deep Dive into FTT’s Technical Indicators
Analyzing FTT’s price action isn’t just about current prices and historical data. It involves technical indicators that provide a more in-depth understanding of the asset’s potential direction.
Starting with the trend based on the moving average, we see a short-term uptrend. This indicates that despite recent dips, FTT is making progressive higher highs and higher lows, suggesting a bullish scenario in the immediate term. However, the medium and long-term simple moving averages (SMA) indicate a downtrend. It means the token has been facing downward pressure over the medium and long term, which is significant for long-term investors.
The Relative Strength Index (RSI) is neutral, implying a balance between buying and selling pressures. It’s a waiting game at this point, as investors watch out for a move in either direction.
FTT’s Moving Average Convergence Divergence (MACD) is bearish, suggesting that sellers have recently been overpowering buyers. However, the trend can change swiftly, so keeping an eye on it is essential.
The Ultimate Oscillator, another significant indicator, is bullish. It signals that we might be looking at an upward swing soon, providing a contrasting view to the MACD.
Lastly, the Average Directional Index (ADX) indicates a weak trend. This suggests that FTT’s price is range-bound for now, and traders should be careful not to get trapped in a false breakout or breakdown.

The Bullish Horizon: A Trade Setup & Outlook for FTT
A possible short-term bullish scenario for FTT is becoming apparent based on the aforementioned indicators. Even though medium and long-term SMAs show a downtrend and the MACD is bearish, the short-term uptrend, a bullish oscillator, and the historical performance provide strong counterpoints.
A key trading setup to consider is buying at the support level of $1.40, betting on the token’s bounce-back ability. A breakout above the $1.51 level could catalyze a move toward the resistance at $2-$2.20, presenting an excellent opportunity for substantial returns. However, traders should also watch for a possible breakdown below $1.40, necessitating an adjustment of their strategies.
About FTT
FTT is a native cryptocurrency token of the FTX cryptocurrency exchange. It offers several utility features within the FTX ecosystem, such as fee discounts, collateral for futures positions, and participation in the exchange’s governance. The token’s performance is fundamentally tied to the success of the FTX exchange, which has grown remarkably over the past few years.
FTT: A Comprehensive Recap
To wrap it all up, FTT sits at a critical juncture, trading at $1.51 with a 2.5% change in the past 24 hours. Although technical indicators present a mixed picture, historical performance, and current market conditions suggest a possible turnaround.
The short-term uptrend, the bullish oscillator, and resilience at the $1.40 support level provide promising signs. While the MACD, medium, and long-term SMA indicate a bearish stance, a possible breakout above the $1.51 level could set the token on a course to test the $2-$2.20 resistance, delivering up to a 35% return.
In summary, FTT is demonstrating the potential for a significant resurgence. With careful analysis and strategic trading, savvy investors and traders could be in for a rewarding ride. Always remember, though, that as with any form of investment, thorough research, and risk management are crucial. Keep your eyes peeled on the market, and happy trading!