Today, we continue our token analysis with Cardano (ADA). Once again, we look at the most essential technical indicators, the latest price developments, and chart patterns and try to provide a recommendation for the month ahead.
ADA Analysis — Overview
As September progresses, Cardano (ADA), currently priced at $0.255 with a modest 24-hour increase of 0.367%, shows a complex set of trends that necessitate a closer look for investors and enthusiasts alike.
Check out our latest article about Ethereum and Bitcoin
→ Ethereum’s September Analysis: Key Insights and Trade Recommendations
→ Bitcoin Price Update: Your Week-Ahead Outlook Unpacked!
Price Performance: A Closer Look
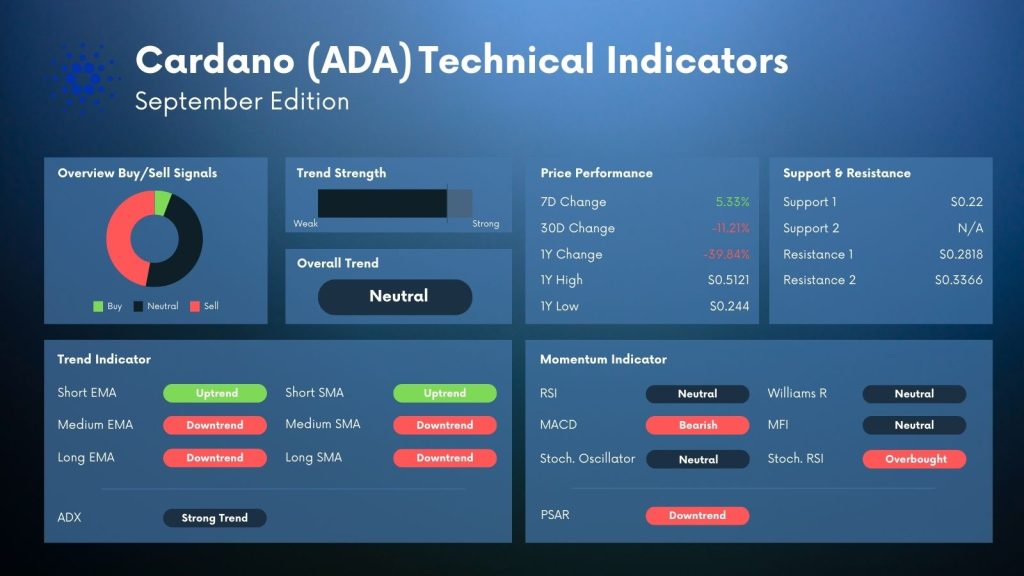
ADA portrays a nuanced picture with its recent price performance. The last week has seen a growth of 5.33%, providing a glimmer of optimism amidst a challenging 30-day period with an 11.21% decline.
ADA — Chart Analysis
The yearly timeline shows a more significant dip, with a decrease of 39.84% from its previous positions, oscillating between a high of $0.5121 and a recent low of $0.244.
A couple of things are essential when looking at the daily chart of ADA. First of all, there was the pivotal moment in June, when ADA broke out of the upward trend to the downside. This led to a major sell-off and brought ADA down to almost $0.20 (temporarily). Although there was a relief rally in July/August, ADA is now back battling the key resistance at $0.25 And this will a major level to watch in terms of further trade recommendations.
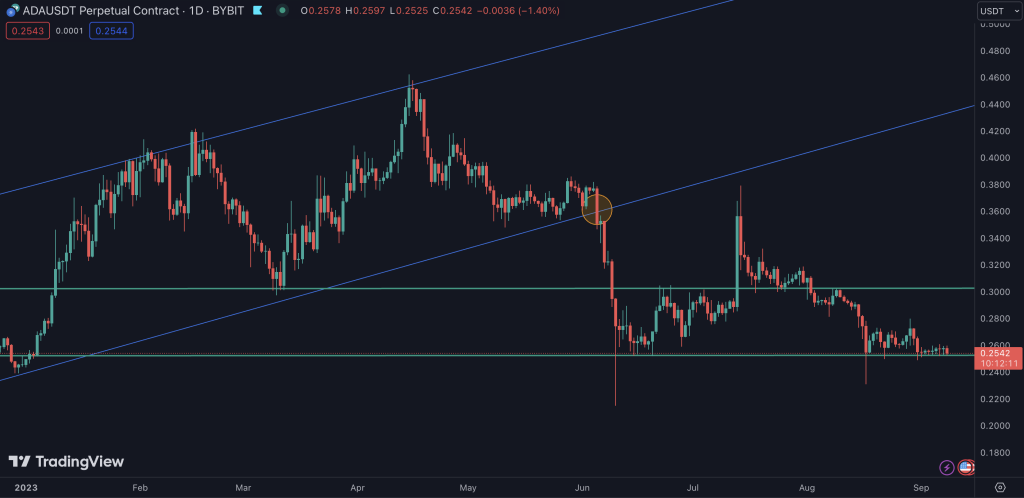
ADA: Support and Resistance Levels: Key Points to Note
As you can see on the chart, ADA is currently trading sideways between two levels. On the downside, we have the major support at $0.25, which shouldn’t be broken by any means. To the upside, the major resistance sits at $0.30.
Trend Strength and Indicators: Mapping the Terrain
ADA is exhibiting a strong trend currently, with various indicators painting a multi-faceted picture of its market dynamics:
- EMA & SMA: The trend indicators present a mixed signal; while the short-term Exponential Moving Average (EMA) and Simple Moving Average (SMA) are in an uptrend, the medium and long-term EMAs and SMAs suggest a downtrend. This indicates potential fluctuations and volatility in ADA’s near future.
- ADX: A strong trend is highlighted by the Average Directional Index, which reflects considerable momentum in ADA’s current market trend.
- Volatility Indicator: The Parabolic SAR (PSAR) is currently pointing towards a downtrend, hinting at a possible continuation of selling pressures.
ADA: Momentum Indicators Analysis
At this point, the Relative Strength Index (RSI) stands at neutral, hinting at a balanced market scenario.
However, a bearish stance is observed in the Moving Average Convergence Divergence (MACD), indicating potential downward pressures.
Other indicators, like the Stochastic Oscillator, Williams R, and Money Flow Index (MFI), align with a neutral position, whereas the Stochastic RSI signals an overbought condition, which might imply an impending correction.
Want to know more about ADA?
→ ADA’s Dance at the Precipice: From Bullish Breakouts to Crucial Support at $0.25
→ ADA — An Inside Peek at the Path to Potential 29% Upsurge
→ Ready For A Comeback? Comprehensive Analysis of Cardano ADA
Trade Recommendation
As mentioned initially, $0.25 is the essential level traders must monitor. If ADA breaks this resistance, it could face tremendous further pressure to the downside. On the other side, a bounce of the level would likely lead to a retest to the resistance at $0.3.
Looking at the various indicators, a bearish scenario might have a higher probability at this moment. Nevertheless, in crypto, things can turn quickly. Therefore, we believe that ADA will hold this major level and bounce from here.
Conclusion: ADA — Navigating a Complex Market Landscape
As we venture deeper into September, ADA presents a complex yet intriguing market scenario. With a blend of uptrends and downtrends reflected in short and long-term indicators, investors might witness a period of volatility and mixed signals. It’s a time for careful navigation, focusing on the strong trend indicators and momentum indicators providing hints towards potential market moves.
This analysis should be used in conjunction with personal research to make well-informed decisions in the dynamic world of crypto investments.
Your Next Step(s)
→ Check out the CryptoKnowledge Platform and enhance your trading skills
→ Start trading ADA