The cryptocurrency market is as dynamic as it is unpredictable. Amid the myriad of coins, Chainlink (LINK) stands out with its unique decentralized oracle network, which aims to connect smart contracts with real-world data.
In this analysis, we will delve into the intricate technical aspects of LINK’s current market performance, discuss potential trading setups, and look at what the charts might be telling us about the future of this token.
About Chainlink (LINK)
Chainlink (LINK) is a decentralized oracle network that aims to bridge the gap between blockchain and off-chain systems by providing reliable, tamper-proof inputs and outputs for complex smart contracts on any blockchain. Founded in 2017 by Sergey Nazarov and Steve Ellis, Chainlink allows blockchains to securely interact with external APIs, payment systems, or any other data source, making it a crucial middleware solution for many decentralized applications (dApps).
Chainlink — Current Status and Indicators
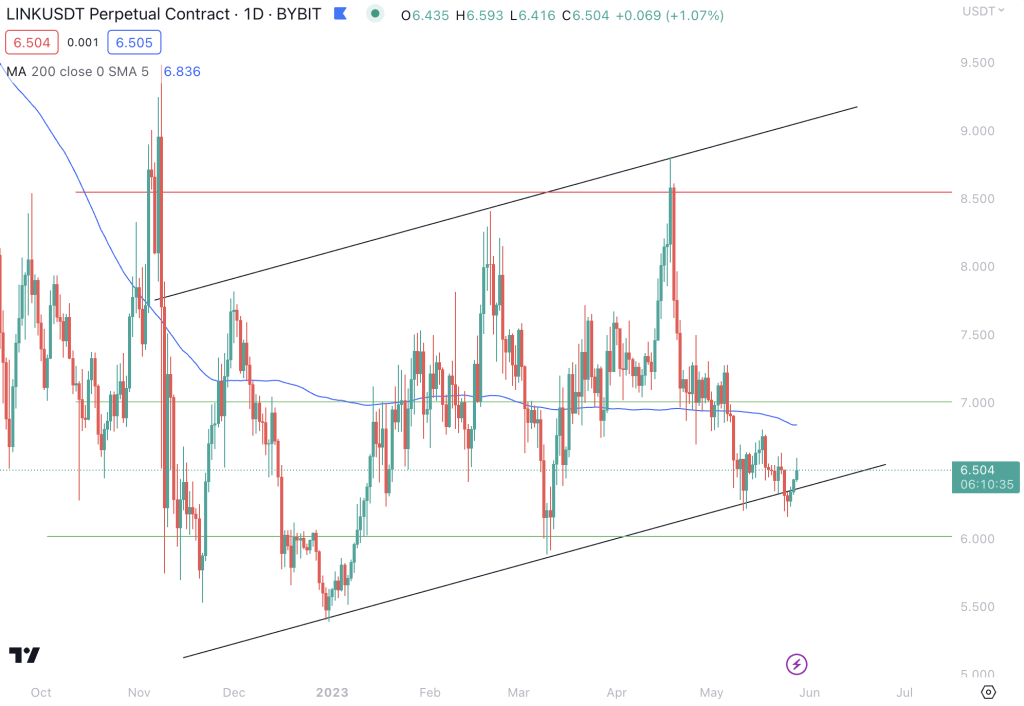
At the moment, Chainlink is trading within an upward channel pattern, a bullish technical pattern often seen during upward trends. Traders who believe that the price is likely to remain within its channel can initiate trades when the price fluctuates within its channel trendlines. It’s important to keep in mind that a breakout could potentially occur in the future, whereby the price either breaks through the upper or lower trendlines of the channel, causing the price to move rapidly in the direction of that breakout.
Despite the current channel-up pattern, Chainlink is experiencing a downtrend across all time horizons – short, medium, and long-term. This scenario underpins the importance of a cautious trading approach.
When it comes to momentum, the situation is somewhat mixed. The MACD line is above the MACD signal line, which is a bullish indicator. However, the RSI is neutral, hovering around the 50 mark, indicating a balanced market with no clear direction for now.
In terms of support and resistance, the nearest support zone for LINK is $6.00, followed by a lower support level at $5.50. The nearest resistance zone is at $7.00, which was a previous support level, followed by a higher resistance at $8.50.
Chainlink — Trade Setup
The trade setup for LINK involves capitalizing on the channel-up pattern in which the token is currently trading. Swing traders can consider entering trades near the lower channel trendline (support) and aim to exit near the upper channel trendline (resistance).
Setting a price alert is recommended to stay informed about significant price movements and potential breakout situations.
Summary
Chainlink (LINK) is a fascinating player in the cryptocurrency market, providing vital infrastructure for the smart contract ecosystem. Currently trading in a channel-up pattern despite an overarching downtrend, LINK offers unique opportunities for traders who can deftly navigate its technical landscape. Traders can craft strategic entry and exit points by carefully monitoring the MACD and RSI indicators and keeping a close eye on key support and resistance levels.
As always, the world of cryptocurrency trading carries inherent risks along with its potential rewards. Therefore, traders should be mindful of their risk management strategies and adjust their trades accordingly. And remember, in the ever-evolving world of digital assets, staying informed and adaptable is key to successful trading.