Evaluating the Status Quo: COMP’s Recent Market Performance
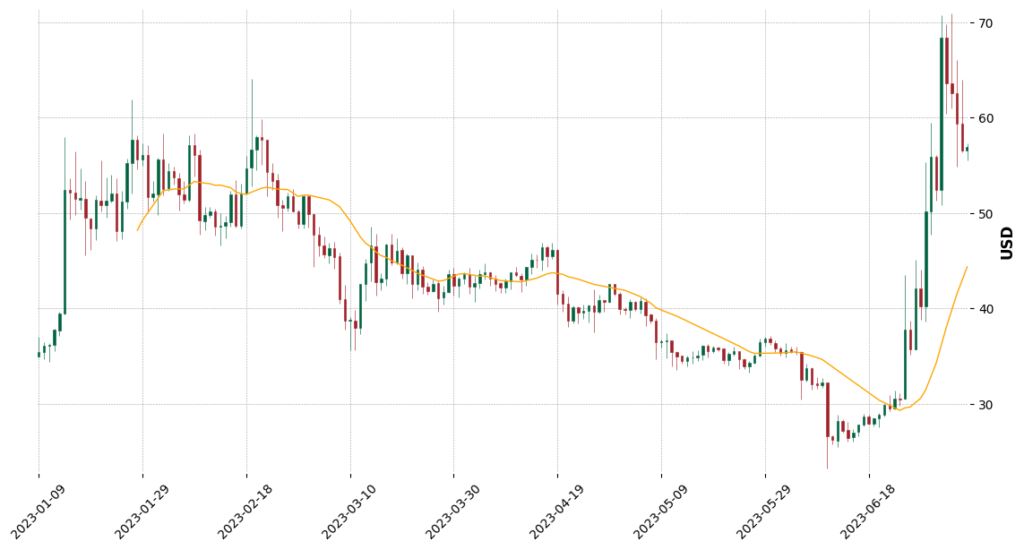
Compound’s COMP token currently trades at $55.99, witnessing a marginal dip of 1.62% in the past 24 hours. The token recently broke above its 200-day moving average with significant trading volumes, thereby confirming a bullish trend reversal.
Following a massive surge of roughly 150%, the token became overbought with a Relative Strength Index (RSI) above 70 near the resistance level of $70. This suggests a potential selling pressure as traders might be inclined to secure profits after the impressive run.
Therefore, a short-term pause in the rally can be anticipated as we await a pullback toward the $47 support level, which could provide a lucrative swing entry opportunity.
An In-depth Look at COMP’s Technical Indicators”
Based on the Simple Moving Average (SMA), COMP is exhibiting an uptrend in the short and medium terms, though the long-term trend is still bearish. The SMA gives an average price over a specific period, and a shift in this average can hint at a new trend. The uptrend in the shorter periods signals bullish momentum, but the long-term downtrend indicates that COMP may still have challenges to overcome.
The RSI for COMP has returned to neutral after crossing into the overbought territory. This indicates that the intense buying pressure has eased, and the market is stabilizing.
The Moving Average Convergence Divergence (MACD), a trend-following momentum indicator, has turned bullish for COMP. This suggests that the momentum is currently on the side of the bulls.
The Oscillator, another valuable tool for identifying market extremes and trend strength, is also in the bullish zone, which strengthens the case for a bullish bias in the market.
Lastly, the Average Directional Index (ADX), which quantifies trend strength, is currently strong. This implies that the current trend, whether up or down, is potent and is less likely to reverse spontaneously.
COMP — Trade Setup & Price Forecast
Despite the recent dip, the short-term forecast for COMP seems cautiously optimistic, given the bullish technical indicators and the confirmed bullish trend reversal. The pullback from the overbought condition provides a good setup for potential swing entries near the $47 support level.
The strong ADX combined with the bullish MACD and Oscillator suggests that the current bullish trend has some steam left. However, traders should be wary of potential selling pressure as profit-taking sets in after the token’s recent rally.
About COMP
Compound (COMP) is a decentralized, blockchain-based protocol that allows users to lend and borrow cryptocurrencies. COMP is the native governance token of the platform, empowering holders with voting rights on the protocol’s development and future decisions. By pioneering algorithmic, autonomous interest rates, Compound has revolutionized the DeFi landscape.
Summary: A Tale of Bullish Breakout and Expected Consolidation
In summary, COMP has recently confirmed a bullish trend reversal with a significant price surge. However, after reaching an overbought state, the token has faced selling pressure near the $70 resistance level. The token’s price now appears to be consolidating, and a pullback toward the $47 support level could present a good swing entry point.
While short and medium-term trends are bullish, the long-term trend based on SMA is still bearish, and the RSI is now neutral after reaching an overbought state. However, other indicators like MACD, Oscillator, and ADX still point towards a bullish bias and strong trend.
Compound continues to make waves in the DeFi world, so the COMP token is one to watch. Investors and traders should stay updated with market movements and adjust their strategies accordingly.