Compound’s Current Position: A Bullish Breakout
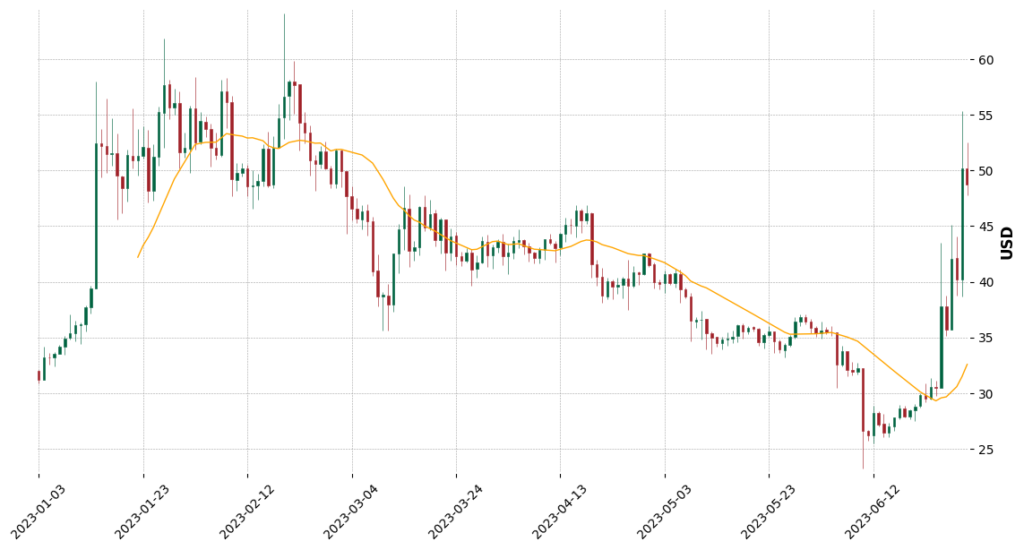
Currently, Compound (COMP) is trading at $56.09, marking a substantial increase of 13.17% within the last 24 hours. In a notable bullish trend reversal, COMP has broken above its 200-day Moving Average (MA), and considerable trading volumes have supported this breakout.
Despite these encouraging signs, traders must note that COMP is currently overbought according to the Relative Strength Index (RSI), which stands above 70. Following recent gains that amount to approximately 150%, it’s probable that a period of consolidation or pullback will ensue as traders take profits and selling pressure builds up. It’s prudent for potential investors to wait for a pullback near the $47 support level before considering a swing entry.
Unravelling Compound’s Technical Indicators
The current trends based on the Moving Average (MA) for COMP suggest a bullish scenario across all timeframes. The Short Term, Medium Term, and Long Term Simple Moving Averages (SMAs) are all in an uptrend, indicating sustained bullish momentum for COMP.
Despite this, the Relative Strength Index (RSI) points to COMP being overbought. The RSI gauges the magnitude of recent price changes to evaluate whether a security is being overbought or oversold. An RSI over 70 typically suggests an overbought condition, which might indicate a forthcoming price correction.
On the brighter side, the Moving Average Convergence Divergence (MACD), a trend-following momentum indicator, is bullish for COMP. This suggests that the short-term momentum is outpacing the long-term momentum, reinforcing the bullish outlook.
The Ultimate Oscillator, a technical indicator that uses weighted averages to provide insights into market momentum, is also in a bullish phase. This shows the momentum is strong and could potentially continue to push the price higher.
The Average Directional Index (ADX), an indicator that measures the strength of a trend, is also strong. This adds further weight to the current bullish momentum and suggests that it is not just a random fluctuation but a strong trend.
Trade Setup and Forecast for Compound
Given the overbought RSI and the significant recent gains, traders should proceed cautiously. There is a high possibility of a pullback or consolidation in the short term, particularly as traders may take profits.
A potential strategy could involve waiting for a pullback to the $47 support level before considering an entry for a swing trade. As the MACD, Ultimate Oscillator, and ADX all support the bullish outlook, there could be a good opportunity to buy on dips and take advantage of the overall uptrend.
Understanding Compound (COMP)
Compound (COMP) is a decentralized, blockchain-based protocol that allows users to lend and borrow cryptocurrencies. As one of the cornerstones of the DeFi (Decentralized Finance) movement, Compound operates on the Ethereum blockchain. Users can earn COMP tokens as interest for lending out their tokens, and borrowers can use their crypto as collateral to secure loans.
Compound (COMP) — Wrapping It Up
In summary, Compound (COMP) is in an uptrend across all timeframes, backed by strong trading volumes and confirmed by various technical indicators. Despite being currently overbought, the overall bullish sentiment remains intact, and a potential pullback could provide an excellent opportunity for a swing trade.
The continued growth of the DeFi sector combined with Compound’s innovative lending and borrowing mechanisms creates a compelling case for its potential future growth. However, like all investments, trading COMP should be approached with careful analysis and strategy adaptation, bearing in mind the inherent volatility of the cryptocurrency market.