In the world of cryptocurrencies, opportunities for impressive returns are not limited to just Bitcoin or Ethereum. Smaller tokens, such as the CORE token, offer intriguing setups that can lead to substantial profits if played right. The potential of CORE to make a comeback after a significant loss, and its readiness for a relief rally, makes it a token to watch in the coming weeks.
About the CORE Token
The CORE token is a relatively less-known cryptocurrency token, but it is by no means less dynamic or potentially rewarding. Although losing 80% of its value since March, the digital asset shows signs of a bottom and a potential reversal, based on the 1-day chart. Currently trading at $1, this token could be gearing up for a big relief rally.
CORE Token — Current Status
Despite a significant depreciation over the past few months, CORE’s indicators are now beginning to suggest a potential upswing. Moreover, the token’s oversold conditions, as evidenced by the Relative Strength Index (RSI) readings of 10 and 8 for RSI14 and RSI25, respectively, indicate that a reversal could be imminent.
Average Directional Index (ADX)
The Average Directional Index (ADX) has shown considerable strength, indicating that the current downward trend of CORE has been strong. However, a strong ADX in a down-trending market can often precede a trend reversal, which could signify a coming shift in the price action.
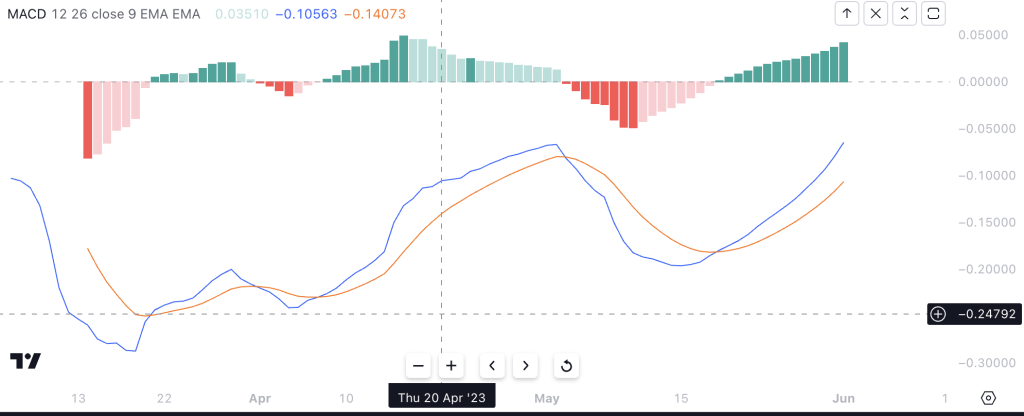
Moving Average Convergence Divergence (MACD)
The Moving Average Convergence Divergence (MACD), a trend-following momentum indicator, has turned bullish. This is an encouraging sign as it could mean the end of the sell-off and the start of a new upward price move. In particular, the MACD line crossing above the signal line is a bullish signal that traders often interpret as the right time to buy.
Oscillator and Momentum
The Oscillator and Momentum (MOM) indicators also present a bullish outlook. Oscillators like the RSI are venturing out from the oversold territory, hinting at a possible price recovery. Moreover, the momentum indicator, which measures the rate of the rise or fall in prices, also shows bullish signs, suggesting an increase in buying pressure.
Moving Averages
In terms of moving averages, while the long-term Simple Moving Average (SMA) and Exponential Moving Average (EMA) continue to illustrate a bearish trend, the picture is beginning to change in the short term. The short-term SMA and EMA have turned bullish, showing that the average price has risen in the recent period. This divergence between short-term and long-term trends might indicate a potential trend reversal.
In summary, while the long-term outlook based on moving averages remains bearish, several other vital indicators hint at bullish developments in the shorter term. This combination, coupled with the highly oversold RSI, may set the stage for a relief rally in the price of CORE.
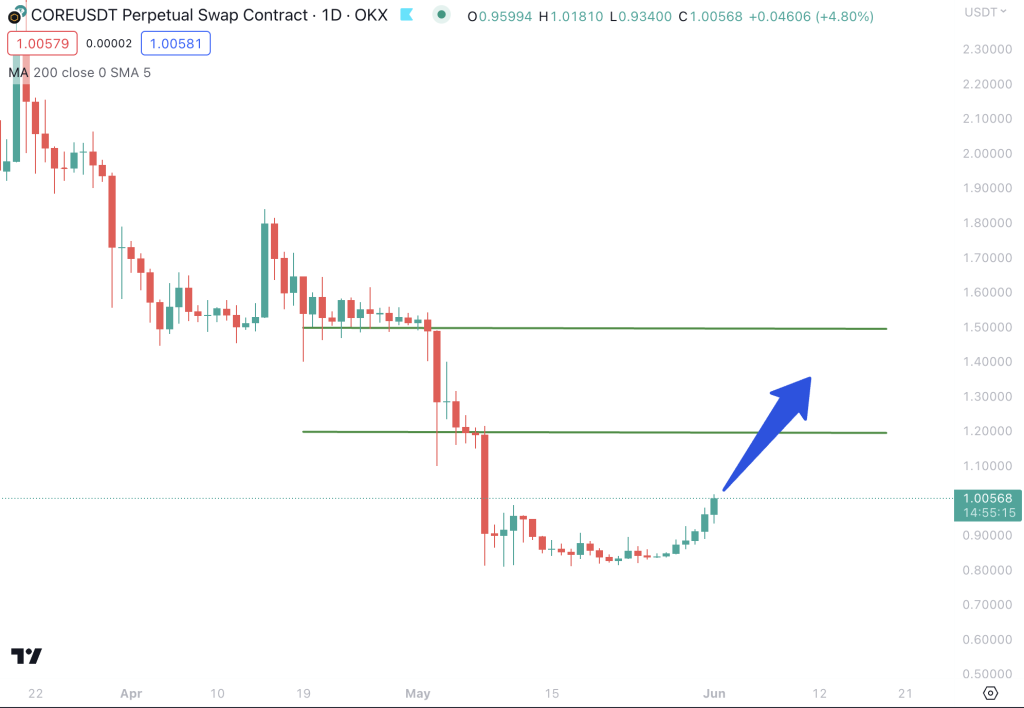
Core Token — Trade Setup
Our assessment leads to an expected relief rally that could push CORE’s price to $1.5, offering a 40% profit potential.
The first significant resistance is expected at $1.2, so it would be wise to set the first target for profit-taking at this level.
However, the path between $1.2 and $1.5 seems clear of significant resistance, making the target more feasible. Upon a successful break of $1.2, the following substantial resistance and target stand at $1.5.
Summary
The technical analysis and market conditions align for a potential CORE relief rally. Despite the token’s significant depreciation since March, indicators suggest that CORE has reached its bottom and is primed for a rally that could yield a 40% profit. However, cautious optimism and risk management should always guide your investment decisions.