Current Status – ATOM’s Market Stand: From Bearish Breakout to Potential Upswing”
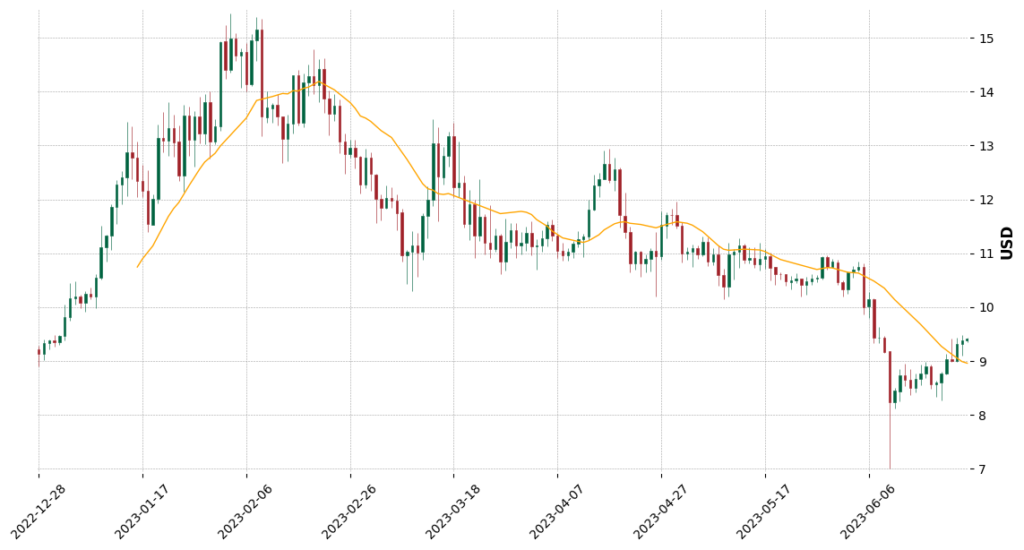
Cosmos, traded under the ticker ATOM, currently holds a trading price of $9.47, signifying a modest 0.62% change in the past 24 hours. ATOM experienced a bearish breakout from a Descending Triangle pattern not long ago, leading to a dip below the $10.50 support level.
The price hit a low of $7.00, but thanks to the market’s resilience, it rebounded from oversold levels (RSI < 30) to find a support level at $8.50, which proved to be a sturdy floor in late 2022.
Recent market behavior shows the momentum swinging towards the bullish side, indicated by the MACD crossover. As such, the price could potentially swing upward toward the $10.00 resistance level. Traders would do well to set a price alert to stay updated.
Technical Indicators – Dissecting ATOM’s Mixed Market Signals
Several key technical indicators are crucial to understanding the current market sentiment around ATOM. The trends based on the Simple Moving Average (SMA) present a short-term downtrend and a long-term downtrend. However, the medium-term view suggests an uptrend, indicating that ATOM has experienced diverse market phases.
The Relative Strength Index (RSI) currently suggests a neutral position, indicating a balance between buying and selling pressures. The Moving Average Convergence Divergence (MACD) presents a bullish signal, pointing toward potential buying opportunities.
However, another momentum indicator, the Ultimate Oscillator, leans bearish, signifying potential selling pressure. Moreover, the Average Directional Index (ADX) shows a strong trend, implying that whether upward or downward, the current trend is powerful and may persist.
The immediate Support Zone lies at $8.50, followed by $7.00. Meanwhile, the nearest Resistance Zone is at $10.00, which was a previous support level, and then at $13.00.
Trade Setup & Outlook – ATOM’s Path Ahead: Bumpy Ride or Smooth Sailing?
Given the current trade setup and technical indicators, ATOM’s short-term price development is set to be an interesting journey. The bullish momentum shown by MACD and the neutral RSI could favor an upward swing toward the $10.00 resistance zone.
However, a strong ADX combined with a bearish Oscillator warrant cautious optimism. Traders should consider setting price alerts and closely monitoring market developments.
Wrap-Up — Reading ATOM’s Cosmic Signals
ATOM’s recent market behavior reflects a complex interplay of bullish and bearish signals. The token’s rebound from oversold levels and subsequent shift towards bullish momentum provide potential upside. Nevertheless, mixed signals from key technical indicators suggest a future trajectory filled with uncertainties. As always, actively monitoring the market and carefully considering multiple indicators will be key in navigating the Cosmos.
About ATOM – “Exploring Cosmos: The Vision and Utility of ATOM”
ATOM, the native token of the Cosmos network, plays a pivotal role in the blockchain ecosystem. Cosmos is a decentralized network of independent blockchains that are powered by Byzantine Fault Tolerance (BFT) consensus algorithms. ATOM serves as a governance token for the network and is used to secure the network, pay transaction fees, and participate in consensus through staking.
The main vision behind Cosmos (ATOM) is to solve some of the biggest problems the blockchain industry faces: scalability, usability, and interoperability. Cosmos aims to create an “Internet of Blockchains,” enabling different blockchains to communicate and interact seamlessly.