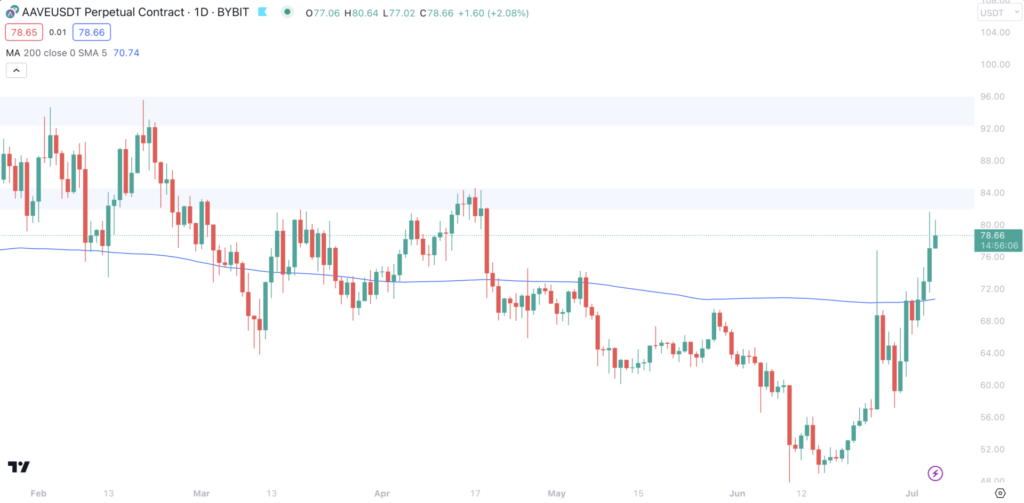
AAVE has been one of the cryptocurrencies that have shown very strong performance over the last weeks. As a result, AAVE surged almost 60% since the beginning of June. However, we think the AAVE has even more potential. This blog post provides a detailed analysis of AAVE’s current status and its technical indicators. On top of that, we discuss a price forecast and corresponding trade setup.
AAVE Current Status: Recouping Strength After Oversold Plunge
At a current trading price of $79.25, AAVE, the native token of the AAVE lending protocol, presents a unique picture of resilience. In the last 24 hours, the price has registered a 1.36% increase, signifying the beginning of a comeback following a dip into oversold territory (RSI < 30) near the $50 support level.
Breaking past the $65 resistance and the crucial $70 mark (200-day MA), AAVE is signaling a potential trend reversal. Its impressive performance sets the stage for a prospective ascension to the $80 mark.
AAVE’s Technical Indicators: Strong Signs of Bullish Momentum
AAVE’s short-term trend, gauged by its moving average, shows an upward trajectory. This indicates a potential bullish market sentiment, which might lead to increased buying pressure in the near future. The medium and long-term trends also align with the short-term trend, indicating a similar uptrend, potentially signifying a trend reversal.
The Relative Strength Index (RSI) is verging on the overbought territory. Although this could lead to a potential dip, it’s also a sign of strong buying momentum recently.
The Moving Average Convergence Divergence (MACD), a tool used to identify potential buy and sell signals, is currently bullish for AAVE. This indicates that the shorter-term momentum is outpacing the longer-term momentum, and the asset might be ripe for buying.
The Ultimate Oscillator, which encompasses short-term, intermediate-term, and long-term price action, is also bullish. This suggests an overall momentum shift towards the buying side, possibly indicating an upswing in the AAVE market.
Lastly, the Average Directional Index (ADX) is strong, suggesting a solid and sustained trend. This means our uptrend is likely to continue, marking a positive signal for prospective AAVE investors.

Trade Setup & Price Forecast: AAVE Gearing up for the Next Rally
Given the current market indicators and trading setup, AAVE shows signs of a potential continued uptrend.
It has successfully rebounded from oversold territory and has cleared key resistance levels, including the crucial 200-day moving average. Although the RSI is nearing overbought levels, the bullish MACD and Ultimate Oscillator readings indicate there might be more room for growth.
$82 – $84 represents the first level to watch. Once this resistance breaks, AAVE has the potential for another run toward the area of $92 – $96. Based on the current price level, this would lead to another 20% run!

Summary: AAVE on the Road to Resurgence
AAVE’s impressive rebound from oversold territory and its subsequent clearance of key resistance levels signal a potentially sustained uptrend.
Short, medium, and long-term moving averages all point towards bullish momentum, a sign that AAVE could continue its ascension toward the $80 mark.
Yet, investors should exercise caution and closely monitor the market as the RSI edges toward the overbought territory.
In all, while AAVE’s current market position presents opportunities, it’s essential to factor in its inherent volatility in the rapidly changing world of cryptocurrencies.
About AAVE
AAVE is an open-source and non-custodial protocol enabling the creation of liquidity markets where users can earn interest on deposits and borrow assets. AAVE tokens act as a governance token in the AAVE ecosystem, giving owners the right to vote on critical protocol matters. Renowned for its flash loans, AAVE has played a critical role in pushing the boundaries of what’s possible in the DeFi landscape.