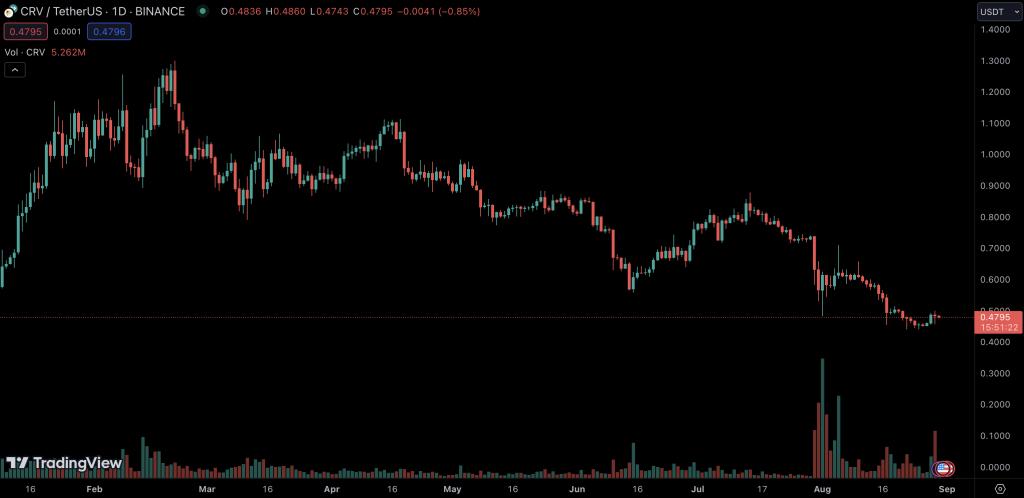
CRV, the native token of Curve, currently trades at $0.479, marking a slight dip of 0.85% over the past 24 hours. Curve, a decentralized exchange primarily utilized for stablecoin swaps, encountered a setback due to a recent exploit. However, there are encouraging signs pointing to both stabilization and recovery in its operations.
A significant development in its price action is the break below the $0.50 support, a threshold that had previously acted as a cushion in November and December of 2022. As market participants, our attention is now drawn to a potential breakout from the Falling Wedge pattern.
A decisive move above the pivotal $0.50 mark would be a strong indicator that the selling pressure has diminished, potentially paving the way for a resurgence in buying momentum.
Technical Indicators: Analyzing CRV’s Technical Health
- Trends based on Moving Average: The short-term moving average for CRV paints a bullish picture, hinting at potential upward momentum. However, the medium and long-term Simple Moving Averages (SMAs) indicate a downtrend, suggesting that the asset has faced bearish pressure recently.
- RSI (Relative Strength Index): Currently, the RSI for CRV stands in a neutral zone. This indicates that neither the buyers nor the sellers are in dominant control, and the asset is not overbought or oversold.
- MACD (Moving Average Convergence Divergence): The MACD, a momentum oscillator, shows a bullish trend. This suggests that there might be increasing positive momentum for CRV in the near term.
- Oscillator: Currently in a bullish state, oscillators provide a glimpse into the momentum of a particular asset, with the bullish indication suggesting potential upward price movement for CRV.
- ADX (Average Directional Index): With a weak ADX, it suggests that CRV might not have a strong trend currently, and the market might be range-bound.
Trade Setup & Outlook: What’s Next for CRV?
Given the blend of technical indicators, CRV presents a mixed bag of potential outcomes. The Falling Wedge pattern suggests that a breakout is on the horizon. If CRV manages to climb above the $0.50 threshold, it could signify a bullish reversal. The bullish MACD and Oscillator further reinforce this optimistic perspective.
However, the weak ADX indicates that traders should exercise caution as the strength of any emerging trend might not be robust. In the short term, staying vigilant and waiting for confirmatory signals might be prudent for potential investors and traders.
About CRV: A Glimpse into Curve’s Ecosystem
Curve (CRV) is not just another token in the vast crypto landscape; it’s the native asset of the Curve decentralized exchange, an entity primarily focused on facilitating stablecoin swaps. Curve has carved a niche for itself by offering low slippage and efficient trades for stablecoin users. Despite facing challenges, Curve’s underlying value proposition remains robust, as it continues to be a vital cog in the DeFi machine, allowing users to maximize their returns while minimizing risks.
Key Takeaways on CRV’s Journey
As CRV maneuvers through a turbulent market, it provides traders with both challenges and opportunities. Despite a recent dip below the $0.50 support, technical indicators like the bullish MACD and Oscillator offer glimmers of hope for a potential rebound. While the Curve ecosystem has faced recent setbacks, its foundational value as a leading stablecoin DEX remains unshaken. As the market awaits a potential breakout from the Falling Wedge pattern, traders would do well to keep a keen eye on the $0.50 mark, a pivotal level that could dictate CRV’s trajectory in the near term.