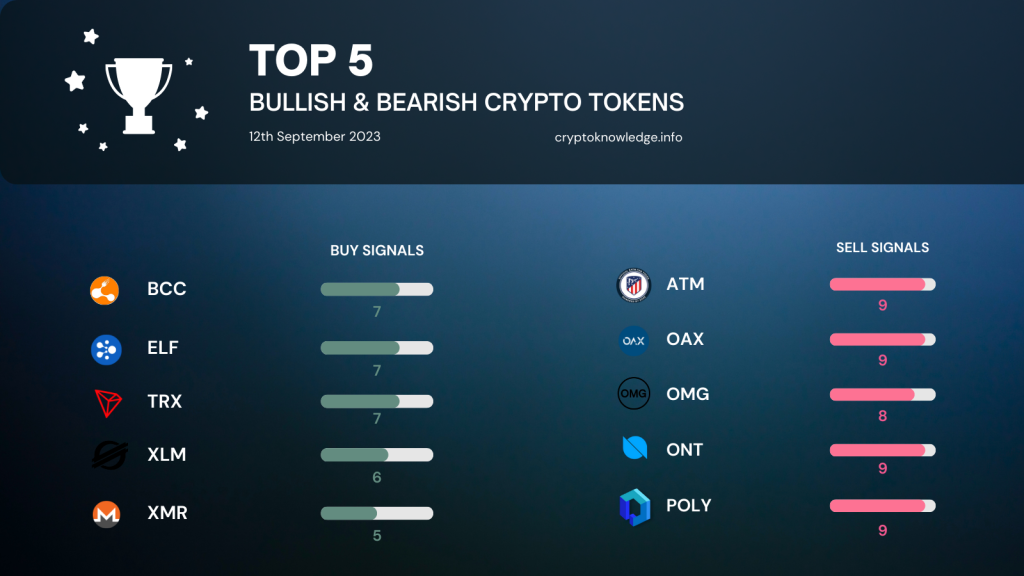
Here’s today’s edition of the Top Bullish and Bearish tokens. Again, we analyzed more than 100 crypto tokens according to nine technical indicators. And here’s the result: The tokens with the most buy and sell signals according to the analyzed indicators.
In today’s swiftly oscillating crypto market, traders and investors are keenly watching the technical indicators to gauge the directional trends of various tokens. These indicators often present valuable insights into the market’s potential bullish or bearish movements. Let us analyze today’s most bullish and bearish crypto tokens based on a comprehensive array of technical indicators.
Top 5 Bullish Crypto Tokens
1. BCC
- Bullish Signals: 7
- Bearish Signals: 3
- Neutral Signals: 3
BCC is a prominent symbol steering towards a bullish wave, showcasing an uptrend in long, medium, and short EMA and SMA. Despite bearing a bearish MACD and reaching an overbought state as indicated by the Williams %R and Stochastic RSI, the asset’s overall performance suggests a potential strong buying sentiment in the market.
2. ELF
- Bullish Signals: 7
- Bearish Signals: 1
- Neutral Signals: 5
ELF follows suit, with an overwhelming number of bullish signals predominantly seen in the upward trend of its EMAs and SMAs. Though the MACD hints at a bearish trend, most of the indicators place ELF in a promising position for investors eyeing bullish assets.
3. TRX
- Bullish Signals: 6
- Bearish Signals: 3
- Neutral Signals: 4
TRX is another contender showing signs of a bullish stance, with a majority of the indicators, such as the long and medium EMAs and SMAs, showing an upward trajectory. Notwithstanding a few neutral and bearish indicators, it remains a token to watch for potential bullish undertones.
4. XLM
- Bullish Signals: 6
- Bearish Signals: 2
- Neutral Signals: 5
XLM displays a majority of bullish signals, particularly evident in the upward trend in EMAs and SMAs, albeit a few neutral indicators and a bearish MACD hint at a mixed sentiment in the market.
5. XMR
- Bullish Signals: 6
- Bearish Signals: 2
- Neutral Signals: 5
XMR mirrors XLM in terms of a bullish stance, with most indicators pointing towards an uptrend, offering a potentially lucrative opportunity for investors with a bullish inclination.
Top 5 Bearish Crypto Tokens
1. ATM
- Bullish Signals: 1
- Bearish Signals: 9
- Neutral Signals: 3
On the flip side, ATM emerges as a strongly bearish contender, with many indicators hinting at a downtrend, signaling investors to tread cautiously.
2. OAX
- Bullish Signals: 2
- Bearish Signals: 9
- Neutral Signals: 2
OAX follows closely, exhibiting a predominantly bearish trend across most indicators, advising investors to possibly steer clear or keep a vigilant eye on developments.
3. OMG
- Bullish Signals: 2
- Bearish Signals: 9
- Neutral Signals: 2
OMG mirrors OAX in terms of bearish sentiment, with most indicators flashing red, warning investors of potential downward pressure.
4. ONT
- Bullish Signals: 2
- Bearish Signals: 9
- Neutral Signals: 2
Like OMG and OAX, ONT presents a substantially bearish outlook, indicating investors might want to adopt a wary approach.
5. POLY
- Bullish Signals: 2
- Bearish Signals: 9
- Neutral Signals: 2
POLY rounds up the top bearish symbols, offering a similar bearish narrative as witnessed in OMG, ONT, and OAX, signaling investors to possibly hold their horses.
Conclusion
As the crypto market continues its dynamic dance, investors and traders are advised to closely monitor these technical indicators. Those bullish on BCC, ELF, or other promising tokens may find this an opportune time to strategize their investments, while a cautious approach might be warranted for tokens showing bearish signs. Remember, the market’s volatile nature necessitates a well-rounded, analytical approach to investment.
Data Creation and Methodology
In constructing this meticulous analysis, we comprehensively assessed over 100 cryptocurrency tokens, leveraging a series of sophisticated financial indicators to delineate the current market sentiments. Here, we elaborate on the process and the specific indicators utilized in our analytical model:
- Relative Strength Index (RSI): Utilized to gauge the magnitude of recent price changes to evaluate overbought or oversold conditions in the price of a stock or other asset.
- Moving Average Convergence Divergence (MACD): A trend-following momentum indicator that shows the relationship between two moving averages of a security’s price.
- Long, Medium, and Short Exponential Moving Average (EMA): These indicators give greater weight to the most recent prices and react more quickly to price changes than simple moving averages. The long, medium, and short classifications refer to the period considered in calculating the average.
- Long, Medium, and Short Simple Moving Average (SMA): These indicators average a set of prices over some time, with equal weighting to all price points. The long, medium, and short classifications pertain to the respective durations of time used in the computations.
- Parabolic SAR (PSAR): A time/price technical analysis tool used to identify potential reversals in the market price direction of traded goods such as securities, futures, and currencies.
- Stochastic Oscillator: A momentum indicator that compares a particular closing price of a security to a range of its prices over a certain period.
- Williams %R (WILLR): A momentum indicator that measures overbought and oversold levels, similar to the stochastic oscillator and RSI.
- Money Flow Index (MFI): A momentum indicator that uses a stock’s price and volume to predict the reliability of the current trend.
- Stochastic RSI (Stoch RSI): This indicator applies the stochastic oscillator formula to RSI values rather than price values, assessing RSI’s internal strength and durability.
The systematic application of these indicators across more than 100 tokens enabled a rigorous and nuanced analysis. The tokens depicted in the preceding section represent the extremities of the market trends, embodying the most bullish and bearish sentiments at the current juncture.
This robust analytical framework offers investors a grounded and data-driven foundation upon which to base their investment decisions, navigating the volatile cryptocurrency market with enhanced precision and insight.
Your Next Step(s)
→ Check out the CryptoKnowledge Platform and enhance your trading skills
→ Start trading on Binance