In the ever-fluctuating landscape of cryptocurrency markets, daily analyses of bullish and bearish trends serve as critical tools for investors seeking to maximize their gains and mitigate risks. Leveraging various technical indicators, this analysis delineates the current landscape by evaluating numerous tokens on the basis of their Relative Strength Index (RSI), Moving Average Convergence Divergence (MACD), Exponential Moving Averages (EMA), Simple Moving Averages (SMA), Parabolic SAR (PSAR), and several other indicators. These metrics collectively provide a robust picture of the potential uptrends, downtrends, or neutral trajectories these tokens might follow in the near future.
In this analysis, we shed light on today’s top 5 bullish and bearish tokens, deciphering the complexities of the market movements through a meticulous study of the indicators mentioned above. Here, we unravel the intricacies of each token’s current status, offering insights into their overbought or oversold conditions and highlighting potential opportunities for investors. Let’s delve deeper into the data to unravel the market’s narrative for these tokens.
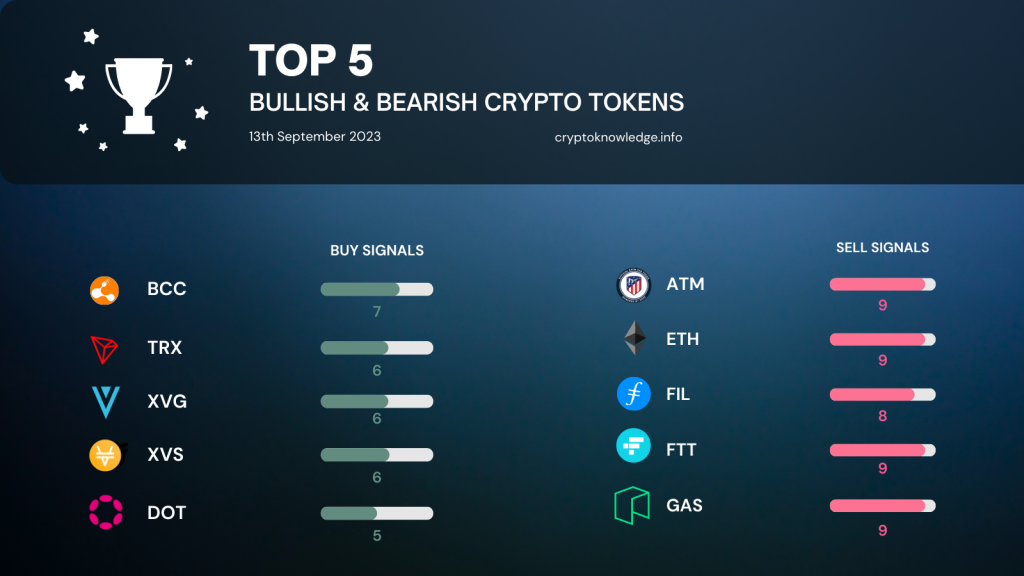
Top 5 Bullish Crypto Tokens:
- BCC is the most bullish token with seven bullish indicators, including consistent uptrends across all EMAs and SMAs. While it has three bearish and three neutral indicators, it’s worth noting that the token is currently in an overbought situation, as indicated by the Willr and Stochastic RSI.
- TRX displays six bullish indications, even though it has five bearish tendencies. Significantly, TRX appears to be oversold across multiple parameters: the Stochastic Oscillator, Willr, and Stochastic RSI.
- XVG, similar to TRX, showcases six bullish tendencies. Despite some token elements pointing toward a downtrend, XVG is also oversold, as indicated by the Stochastic Oscillator, Willr, and Stochastic RSI.
- XVS has 6 bullish tendencies but a mix of other indicators, with three bearish and four neutral. The token is currently in an oversold condition as indicated by the Stochastic RSI.
- DOT is more bearish, with eight bearish indicators and only five bullish ones. All EMAs and SMAs are showing a downtrend, and it is heavily oversold, making it a potentially interesting token to watch.
Top 5 Bearish Crypto Tokens:
- ATM is highly bearish with nine bearish indicators, primarily showing downtrends across EMAs and SMAs. Despite being bearish, it is oversold according to the Willr and is overbought based on the Stochastic RSI.
- ETH, a prominent token, is currently showing strong bearish signals with 9 bearish indicators, all pointing towards a downturn. Notably, the Stochastic RSI suggests it is in an overbought condition.
- FIL mirrors ETH’s pattern with nine bearish and 0 bullish indicators. The Stochastic RSI also indicates that FIL is in an overbought state.
- FTT follows a similar trend with nine bearish indications and none in the bullish column. It’s also overbought according to the Stochastic RSI.
- GAS completes the bearish list with nine bearish tendencies, with its EMAs and SMAs all pointing downwards. GAS is another token that, despite its bearish outlook, is in an overbought situation as shown by the Stochastic RSI.
In summary, while several tokens like BCC, TRX, and XVG are showing bullish tendencies, there is a significant number, including major ones like ETH, that are currently in a bearish trend. However, the oversold or overbought conditions of many of these tokens might present potential opportunities for traders.
Data Creation and Methodology
In constructing this meticulous analysis, we comprehensively assessed over 100 cryptocurrency tokens, leveraging a series of sophisticated financial indicators to delineate the current market sentiments. Here, we elaborate on the process and the specific indicators utilized in our analytical model:
- Relative Strength Index (RSI): Utilized to gauge the magnitude of recent price changes to evaluate overbought or oversold conditions in the price of a stock or other asset.
- Moving Average Convergence Divergence (MACD): A trend-following momentum indicator that shows the relationship between two moving averages of a security’s price.
- Long, Medium, and Short Exponential Moving Average (EMA): These indicators give greater weight to the most recent prices and react more quickly to price changes than simple moving averages. The long, medium, and short classifications refer to the period considered in calculating the average.
- Long, Medium, and Short Simple Moving Average (SMA): These indicators average a set of prices over some time, with equal weighting to all price points. The long, medium, and short classifications pertain to the respective durations of time used in the computations.
- Parabolic SAR (PSAR): A time/price technical analysis tool used to identify potential reversals in the market price direction of traded goods such as securities, futures, and currencies.
- Stochastic Oscillator: A momentum indicator that compares a particular closing price of a security to a range of its prices over a certain period.
- Williams %R (WILLR): A momentum indicator that measures overbought and oversold levels, similar to the stochastic oscillator and RSI.
- Money Flow Index (MFI): A momentum indicator that uses a stock’s price and volume to predict the reliability of the current trend.
- Stochastic RSI (Stoch RSI): This indicator applies the stochastic oscillator formula to RSI values rather than price values, assessing RSI’s internal strength and durability.
The systematic application of these indicators across more than 100 tokens enabled a rigorous and nuanced analysis. The tokens depicted in the preceding section represent the extremities of the market trends, embodying the most bullish and bearish sentiments at the current juncture.
This robust analytical framework offers investors a grounded and data-driven foundation upon which to base their investment decisions, navigating the volatile cryptocurrency market with enhanced precision and insight.
Your Next Step(s)
→ Check out the CryptoKnowledge Platform and enhance your trading skills
→ Start trading on Binance