After Bitcoin broke out of its descending channel and pumped above $30,000, altcoins also moved to the investors’ focus. In this blog post, we take a closer look at Polkatdot (DOT). We discuss the crypto token’s current situation and present an outlook together with a potential trade setup.
Current Status — A Snapshot of Polkadot’s Performance
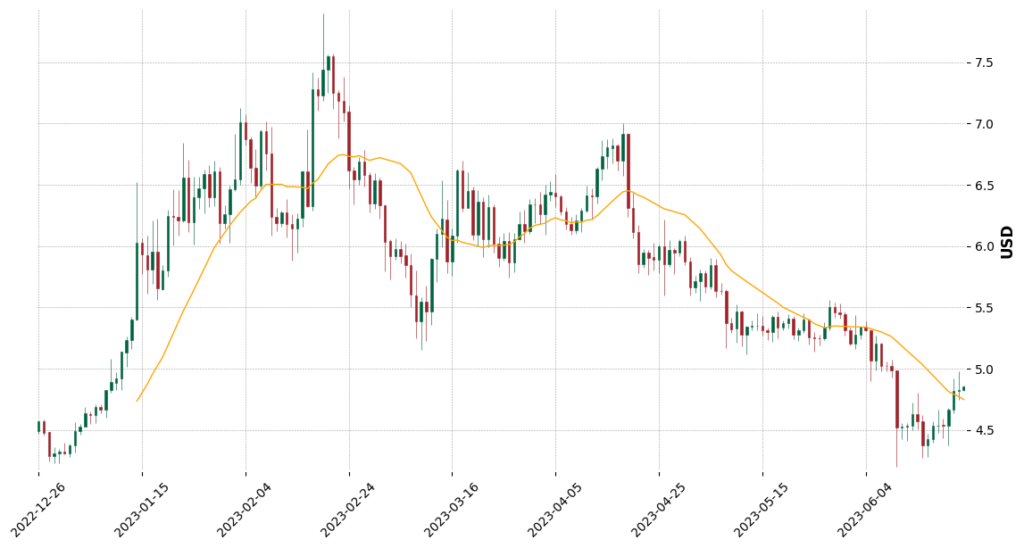
Polkadot’s native token, DOT, is currently trading at $4.90, marking a marginal price change of 1.03% over the last 24 hours. This slight upward move may not be game-changing, but it signifies resilience in a market known for its volatility. While the broader crypto market fluctuates, DOT holds its ground, albeit with a downward overall trend.
The token experienced a bearish breakout from its descending triangle, causing prices to plummet to a low of $4.20. This dip pushed the token into oversold territory, with the Relative Strength Index (RSI) dipping below 30. However, it’s not all gloom and doom for DOT, as this level held up solidly in late 2022. The token has since rebounded and is now gearing up to challenge the $5 resistance.
To shake off its current downtrend, DOT must break past the 200-day moving average which sits at $5.70. It’s a key threshold that traders should keep a close eye on.
Polkadot (DOT) — Technical Indicators
Understanding technical indicators is paramount for gauging a token’s trajectory, and it’s no different in the case of DOT.
The trends based on moving averages suggest a mixed bag of possibilities for DOT. In the short term, we see an uptrend indicated by the Simple Moving Average (SMA), suggesting potential for gains in the immediate future. The medium-term also displays an uptrend, providing some hope for those seeking mid-term investment opportunities.
However, the long-term SMA suggests a downtrend, signaling that DOT may face a bumpy ride ahead in the larger time frame. Yet, it’s worth remembering that such projections are not written in stone, and market dynamics could shift.
The RSI sits in neutral territory, indicating that DOT is neither overbought nor oversold at this moment. It’s a state of balance that could tip either way.
The Moving Average Convergence Divergence (MACD) indicator offers a sliver of optimism. It’s signaling a bullish trend, hinting at potential upward momentum.
However, the oscillator contrasts this by pointing towards a bearish outlook, suggesting the possibility of lower prices. Likewise, the Average Directional Index (ADX), which measures the strength of a trend, is weak. This could mean that the prevailing trends, be they bullish or bearish, may not be strong.
Lastly, regarding support and resistance, the nearest support zone for DOT sits at $4.20, providing a safety net for the token. On the other hand, the nearest resistance zone is at $5.00, which was a previous support level. Further resistance can be found at $6.00 and then $8.00.
Polkadot (DOT) — Trade Setup & Outlook
Based on the array of indicators above, the short-term outlook for DOT might present a few obstacles before seeing a potential uptrend. The token is currently in limbo, with a mix of bullish and bearish indicators. The neutral RSI and the bullish MACD suggest a potential for an upside, but the bearish oscillator and the weak ADX signal a lack of clear directional strength.
The primary focus is the $5.00 resistance level. A strong break and close above this point could lead to a potential run toward the next resistance at $6.00. However, if the bearish indicators hold true and DOT fails to break the $5.00 resistance, we could see a retreat toward the support level at $4.20.
Therefore, in the short term, traders should closely monitor these key levels and trade accordingly, setting a price alert for the 200-day moving average at $5.70.
Wrap-Up — Riding the Waves with DOT
This comprehensive look at DOT’s market position paints a picture of resilience amid volatility. Despite a downward trend, the token’s performance hints at a potential for a turnaround, especially if it can break past key resistance levels.
The technical indicators present a mixed outlook with signals for both bearish and bullish trends. Whether DOT can clear the immediate resistance of $5.00 will significantly impact the short-term price movement. Beyond just numbers, the DOT token lies at the heart of Polkadot’s ambitious mission to revolutionize blockchain connectivity.
Navigating the crypto market requires a careful blend of technical analysis, market sentiment, and understanding of the underlying asset. As the market unfolds, whether DOT sinks or swims in these uncertain waters, will be a spectacle to watch.
[stockdio-historical-chart symbol=”DOT” stockExchange=”Crypto” width=”880″ height=”580″ motif=”financial” palette=”financial-light”]
About Polkadot (DOT)
Polkadot’s native token, DOT, is the cornerstone of a multichain, interoperable network designed to bring a new level of connectivity to the internet. It powers the Polkadot network’s operations including governance, staking, and bonding. Its uniqueness lies in its ability to allow diverse blockchains to transfer any type of data or asset across platforms, creating an interconnected web of blockchains, or a ‘Polkadot.’