For more chart patterns, trading signals, and crypto data, download our app in the Appstore or Playstore: Download Now
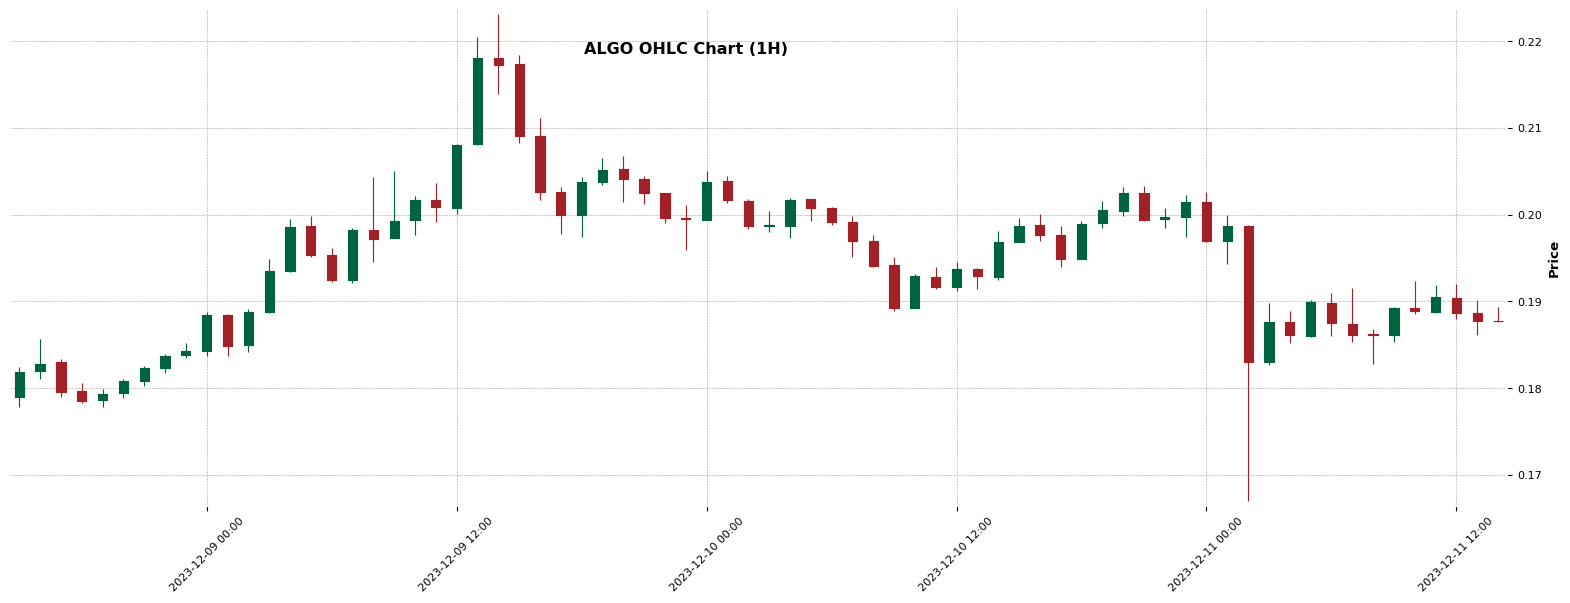
ALGO – Triple Bottom identified (1H)
Chart Pattern Information
Based on the most recent data, a potential bullish ‘Triple Bottom’ chart pattern is currently forming on the ALGO hourly chart. This pattern began forming on December 9, 2023, and appeared to mature by December 11, 2023. The pattern depicts a price movement between $0.1959 to $0.205, eventually settling at an entry point of $0.2029. However, it’s essential to note that this pattern is still in the process of forming and remains incomplete. Potential investors may look out for the profit margin standing at $0.2426, but they should also be aware of the stop-loss point, which is $0.1632.
About ALGO
Algorand (ALGO) is a cryptocurrency . Algorand has a current supply of 8,006,619,817.579909. The last known price of Algorand is 0.188 USD and is down -2.99 over the last 24 hours. It is currently trading on 381 active market(s) with $140,449,590.63 traded over the last 24 hours. More information can be found at http://algorand.foundation.
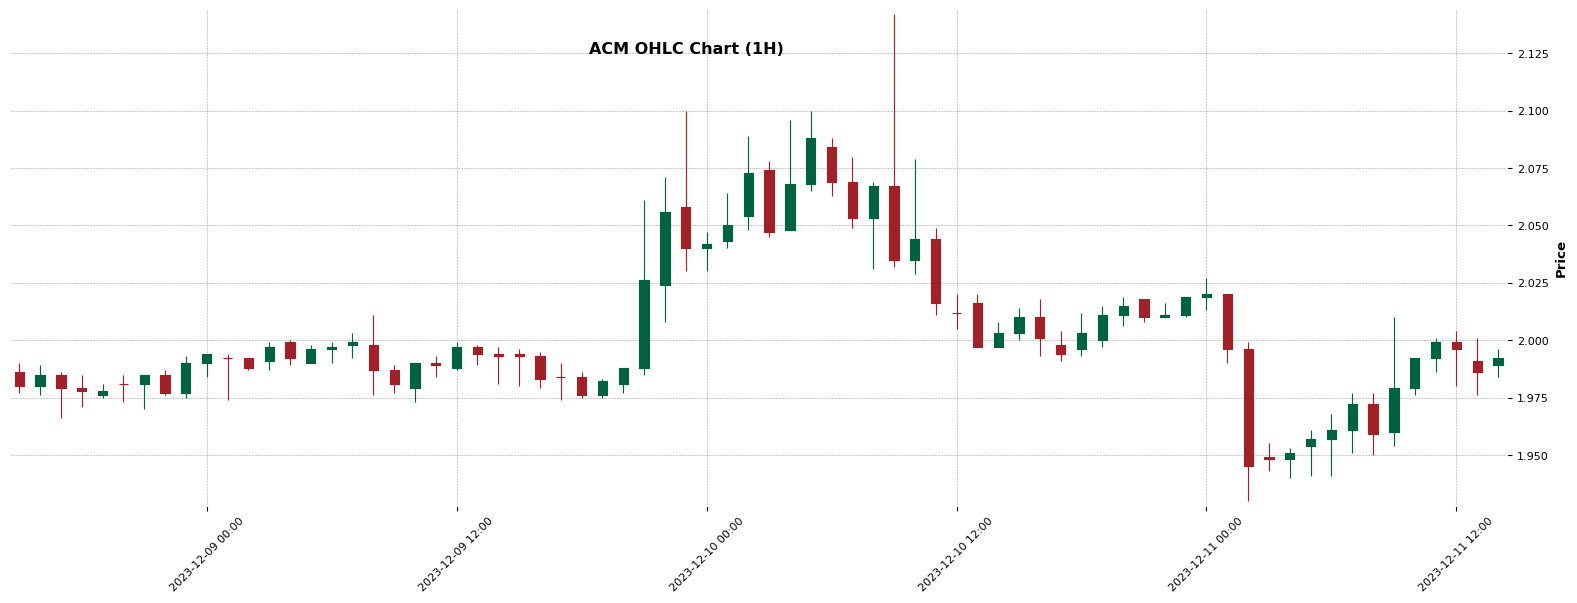
ACM – Wedge identified (1H)
Chart Pattern Information
Currently, Advanced Charting Methods (ACM) is indicating a potentially forming chart pattern called ‘Wedge’ on the hourly chart. The pattern started emerging from a price of 2.142 at 09:00 on December 10, 2023, slumped to 1.997 at 13:00 the same day, recovered slightly to 2.027 around midnight and dipped to 1.93 at 02:00 on December 11, 2023. The intersection price is forecasted at 1.762 around 09:00 on December 12, 2023. This pattern remains incomplete and its type is unknown. Further developments are awaited to determine a potential entry or stop loss point.
About ACM
AC Milan Fan Token (ACM) is a cryptocurrency and operates on the Chiliz platform. AC Milan Fan Token has a current supply of 20,000,000 with 6,027,896 in circulation. The last known price of AC Milan Fan Token is 1.990 USD and is down -0.75 over the last 24 hours. It is currently trading on 36 active market(s) with $1,872,556.81 traded over the last 24 hours. More information can be found at https://www.socios.com/.
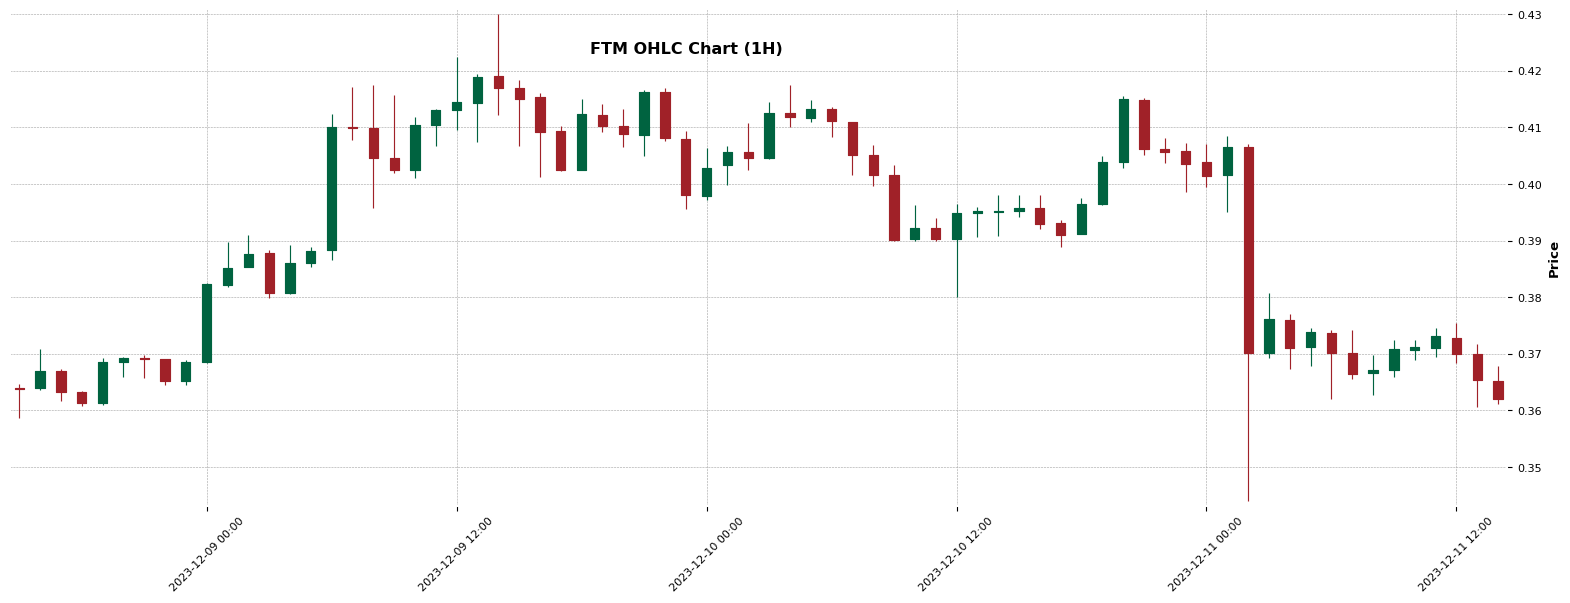
FTM – Triple Bottom identified (1H)
Chart Pattern Information
An interesting pattern is currently forming on the FTM’s hourly chart as of December 9, 2023. This is a ‘Triple Bottom’ pattern, which is generally considered bullish. The pattern began forming at 18:00 with a start price of 0.4187. Critical points in the pattern include a high at 0.4175 (04:00 on 12/10), a low at 0.38 (12:00 on 12/10), and a subsequent high of 0.4156 (20:00 on 12/10). The current entry point stands at 0.415, while the stop loss is set at 0.3366. This pattern is still maturing and remains incomplete. Investors are advised to keep a close watch for potential profitable exits.
About FTM
Fantom (FTM) is a cryptocurrency launched in 2018. Fantom has a current supply of 3,175,000,000 with 2,803,634,835.5265927 in circulation. The last known price of Fantom is 0.365 USD and is down -7.96 over the last 24 hours. It is currently trading on 555 active market(s) with $132,580,152.07 traded over the last 24 hours. More information can be found at https://fantom.foundation/.
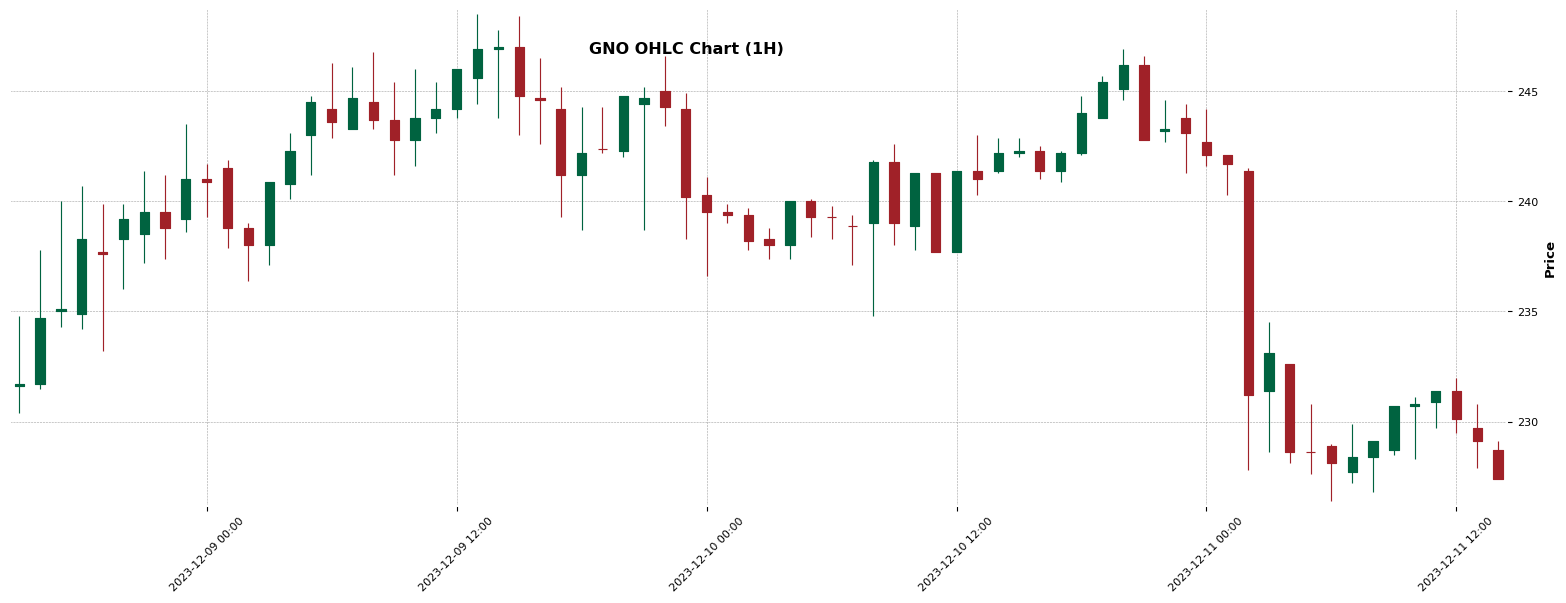
GNO – Triple Top identified (1H)
Chart Pattern Information
A triple top bearish pattern is currently forming on the GNO’s hourly chart as of 7th December 2023. The pattern started at 17:00 with a price of 220.93, peaked at 22:00 at 250, dipped to 222 by 1:00 on 8th December, and rose again to 238 by 2:00. As of 14:00, the price has shown a recovery to 243.1. However, the pattern is yet to mature and is recorded as incomplete. This potentially predicts a further downward movement with profits anticipated around 194.13, provided the price doesn’t exceed the stop loss limit of 252.8. The current entry price is marked at 223.47.
About GNO
Gnosis (GNO) is a cryptocurrency and operates on the Ethereum platform. Gnosis has a current supply of 3,000,000 with 2,589,588 in circulation. The last known price of Gnosis is 228.99 USD and is down -5.27 over the last 24 hours. It is currently trading on 165 active market(s) with $10,174,805.37 traded over the last 24 hours. More information can be found at https://gnosis.io/.
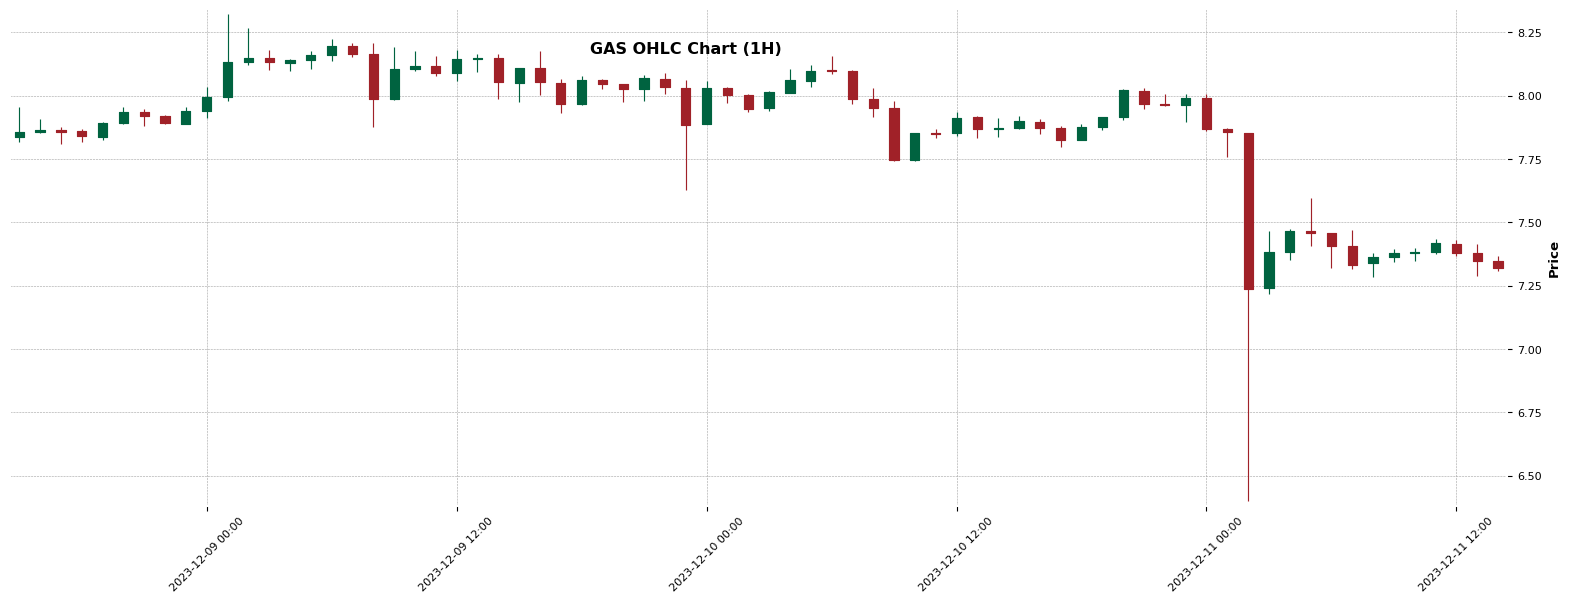
GAS – Double Bottom identified (1H)
Chart Pattern Information
The data points to an emerging bullish pattern on the GAS hourly chart, referred to as a ‘Double Bottom’. This pattern, still in formation as of the latest timestamp (‘2023-12-11 01:00:00’), indicates potential for an upward breakout from an entry point of 8.157. Be sure to monitor this development as a mature Double Bottom pattern could lead to profits around 8.686 level, given the stop-loss order is set at 7.5751. The pattern is not yet completed, thus monitoring its progression is crucial. The data complements the pattern-identification as a useful tool for making informed trading decisions.
About GAS
Gas (GAS) is a cryptocurrency and operates on the Neo platform. Gas has a current supply of 65,344,118. The last known price of Gas is 7.342 USD and is down -7.03 over the last 24 hours. It is currently trading on 99 active market(s) with $64,535,993.15 traded over the last 24 hours. More information can be found at https://neo.org/.
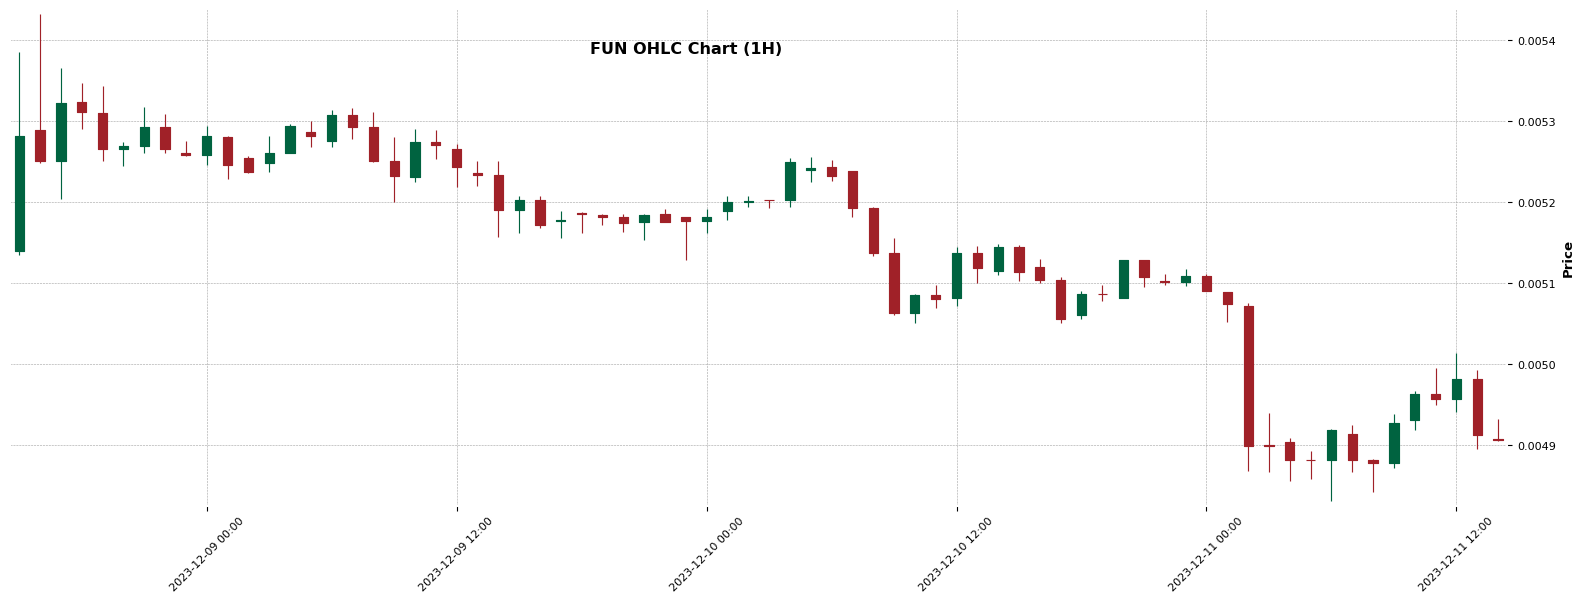
FUN – Double Bottom identified (1H)
Chart Pattern Information
A bullish ‘Double Bottom’ pattern is potentially forming on the hourly chart of FUN, indicating a possible upward trend. This pattern started forming on December 9, 2023 at 12:00, hitting an initial low at 0.005129 on the same day at 23:00. The price then peaked at 0.005256 on December 10 at 05:00, before dipping to another low of 0.00505 at 17:00 that day. Currently, the pattern is incomplete with the entry price established at 0.005256. Traders may want to place their stop loss at around 0.0050294 and aim for an initial profit at 0.005462.
About FUN
FUNToken (FUN) is a cryptocurrency launched in 2017and operates on the Ethereum platform. FUNToken has a current supply of 10,977,277,070.398026 with 10,962,808,529.398026 in circulation. The last known price of FUNToken is 0.0049 USD and is down -4.00 over the last 24 hours. It is currently trading on 53 active market(s) with $1,358,300.82 traded over the last 24 hours. More information can be found at https://funtoken.io/.
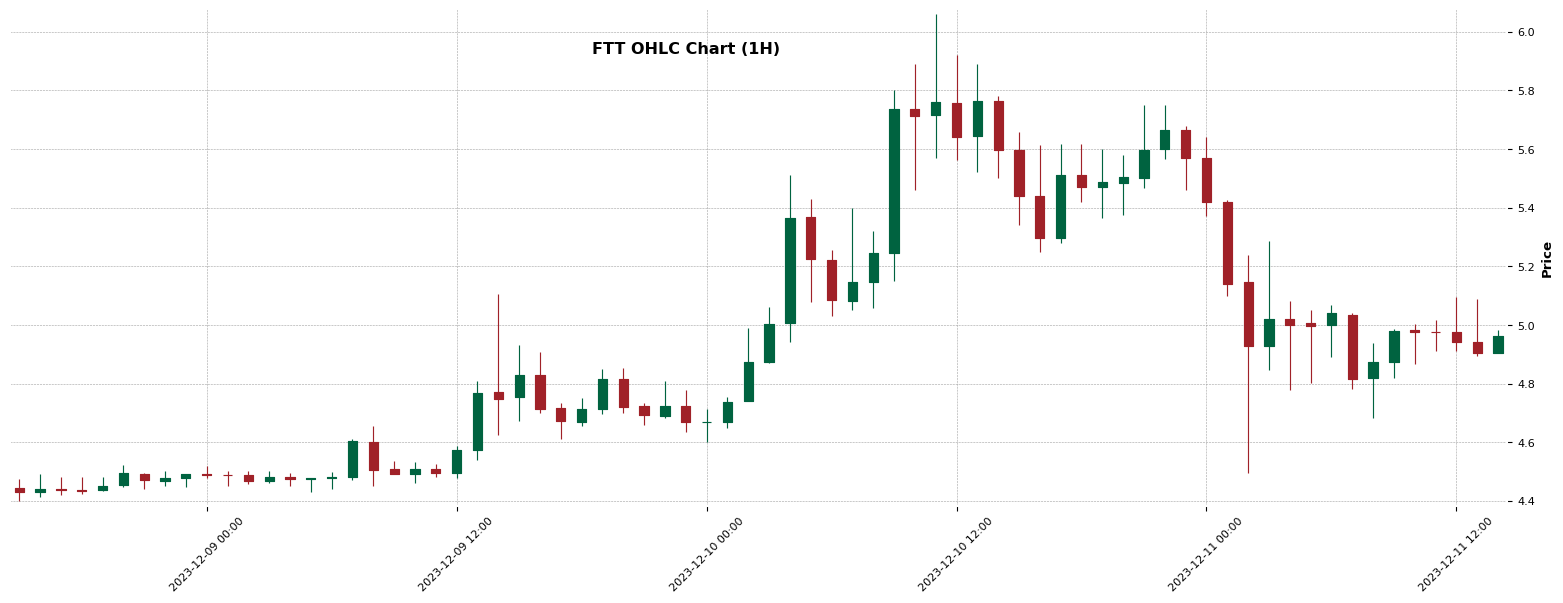
FTT – Double Top identified (1H)
Chart Pattern Information
FTT is in the process of forming a ‘Double Top’ chart pattern on its hourly chart, which suggests potential bearish movement. The model started at 5.25 on December 10, 2023, at 09:00 and developed to a high of 6.06 at 11:00, returning to the initial value at 16:00. A partial rebound occurred at 22:00 with a price of 5.75 before falling back to 5.25 on December 11 at 01:00. As the pattern is still incomplete, the ensuing movement is not fully predictable yet. Nevertheless, this developing pattern indicates potential opportunities for trades with a stop loss at 6.141 and a profit target initially at 4.44.
About FTT
FTX Token (FTT) is a cryptocurrency launched in 2019and operates on the BNB Beacon Chain (BEP2) platform. FTX Token has a current supply of 328,895,103.813207. The last known price of FTX Token is 4.926 USD and is down -12.52 over the last 24 hours. It is currently trading on 200 active market(s) with $216,950,689.09 traded over the last 24 hours.
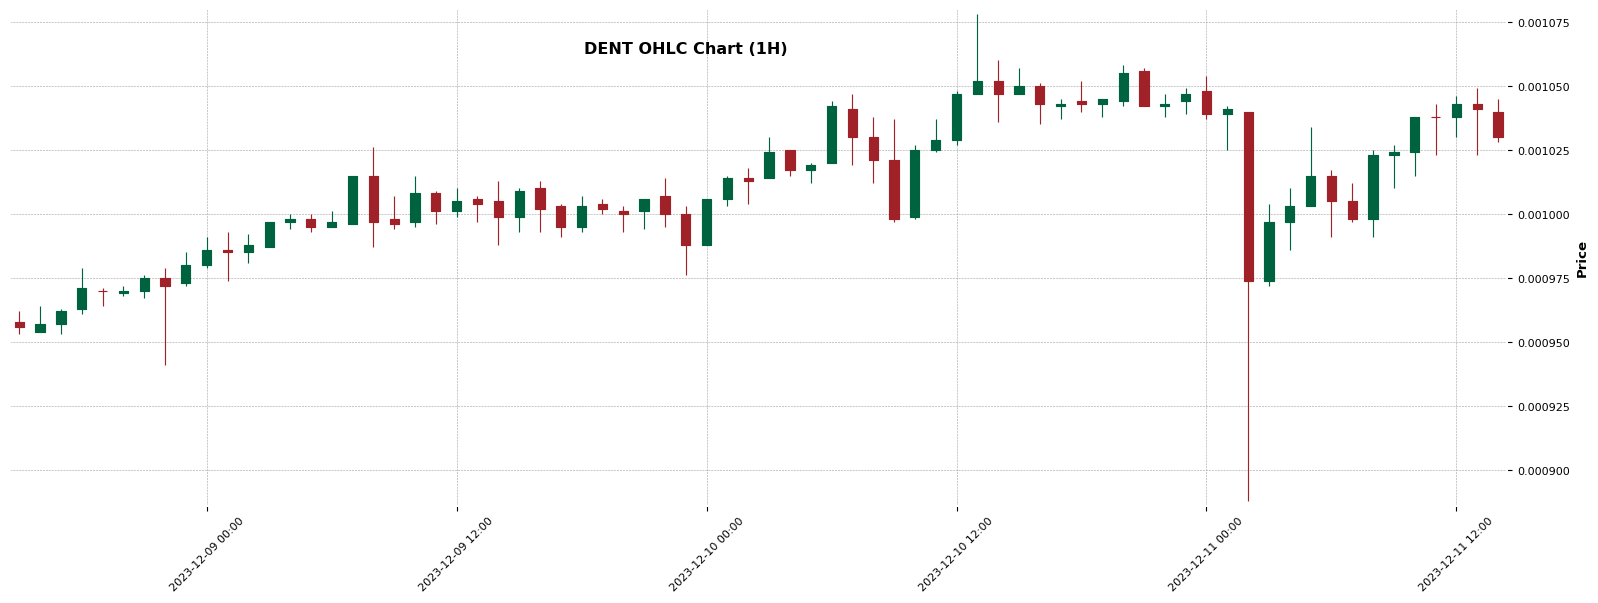
DENT – Triple Top identified (1H)
Chart Pattern Information
The DENT hourly chart is presently in the progress of forming a bearish ‘Triple Top’ pattern. The development of this pattern began on December 9, 2023, with a start price of 0.00093. It peaked at 0.001025 on December 9, dropped to 0.000976, then rose again to 0.001047 on December 10. However, as of 14:00 on December 10, 2023, the pattern is yet to mature, ending with a price of 0.0010075. Note that the stop loss for this pattern is set at 0.0010882. Remember, this analysis is based on incomplete data and might change as more data becomes available.
About DENT
Dent (DENT) is a cryptocurrency and operates on the Ethereum platform. Dent has a current supply of 99,999,999,999.99994. The last known price of Dent is 0.001041 USD and is down -1.53 over the last 24 hours. It is currently trading on 92 active market(s) with $8,017,883.72 traded over the last 24 hours. More information can be found at https://www.dentwireless.com/.
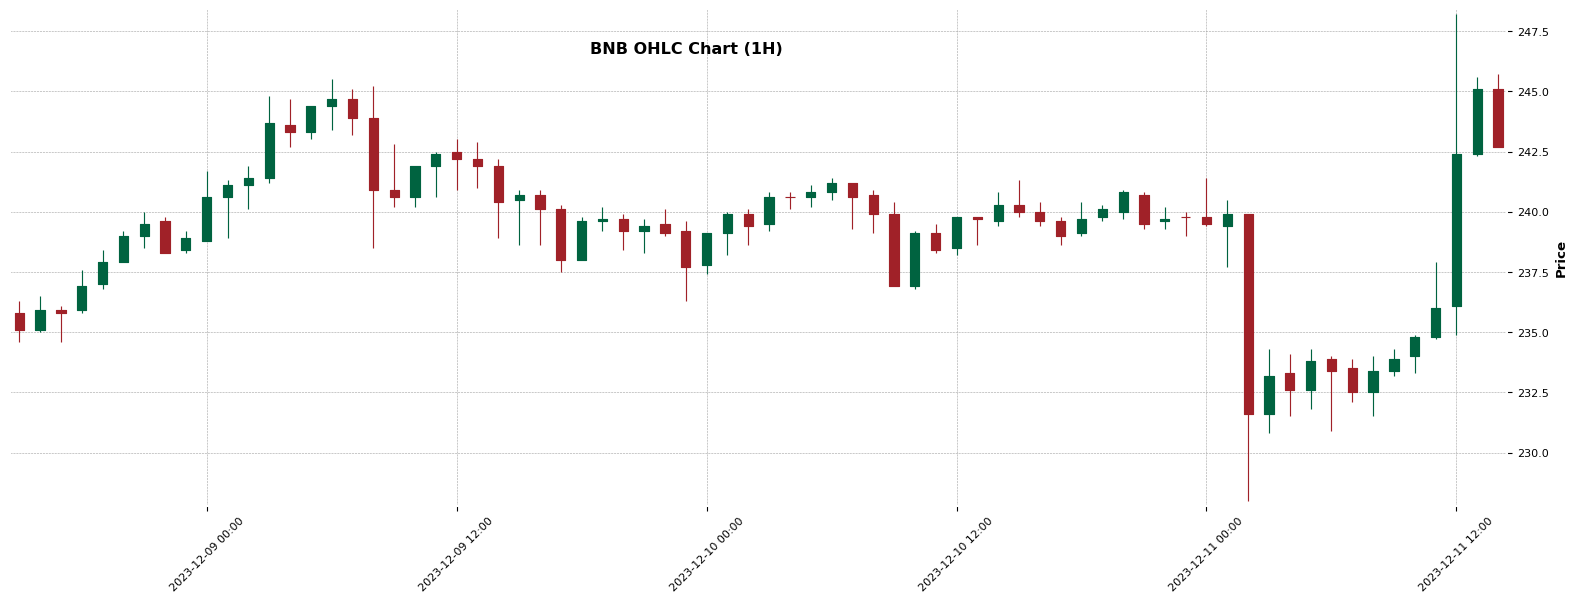
BNB – Double Bottom identified (1H)
Chart Pattern Information
A Double Bottom bullish pattern is potentially forming in the hourly chart of BNB. The pattern initiated on 2023-12-09 at 14:00, with the start price at 241.4. A dip to aprice at 236.3 was recorded at 23:00 on the same day. On the following day, there was a rise to 241.4 at 06:00, followed by a drop to 236.8 at 10:00. The pattern is expected to mature at a price of 241.4 by 2023-12-11 00:00. This incomplete pattern suggests a potential entry point at 241.4 with a stop loss at 235.79 and a first profit level at 246.5.
About BNB
BNB (BNB) is a cryptocurrency . BNB has a current supply of 151,696,613.0112207. The last known price of BNB is 244.06 USD and is up 1.67 over the last 24 hours. It is currently trading on 1831 active market(s) with $1,152,566,470.11 traded over the last 24 hours. More information can be found at https://bnbchain.org/en.
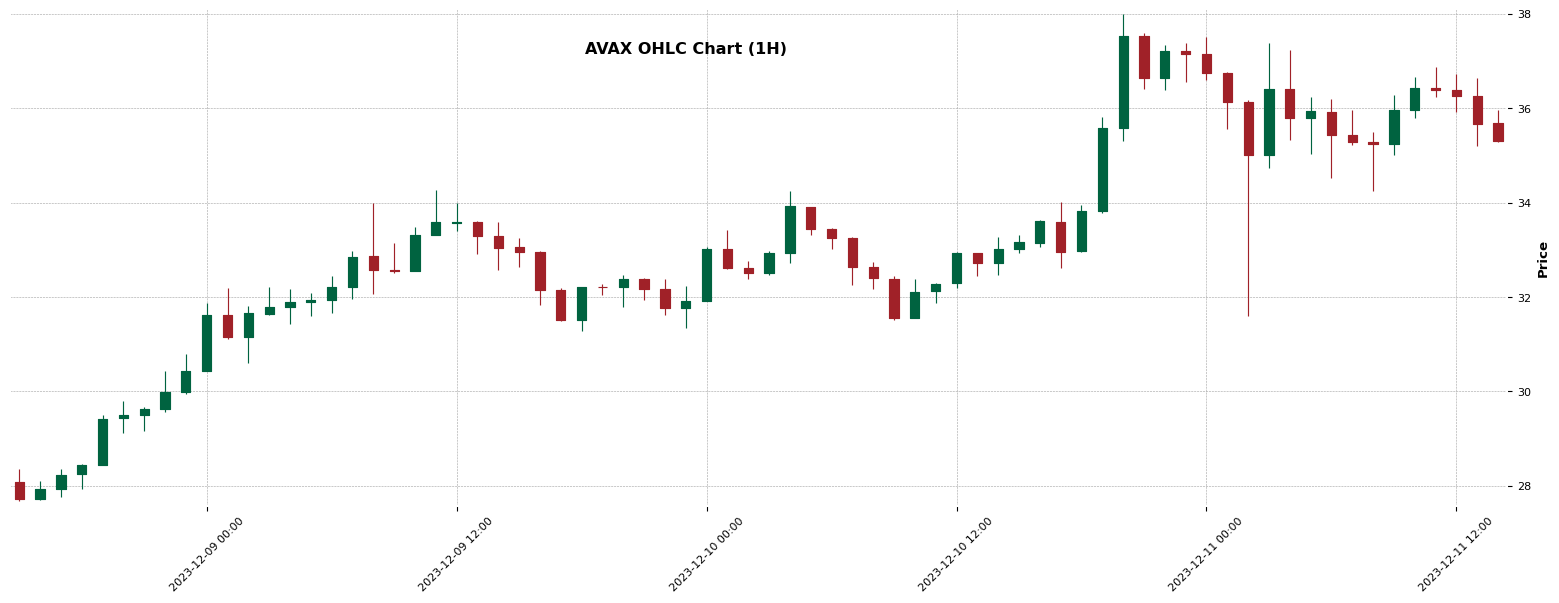
AVAX – Triple Top identified (1H)
Chart Pattern Information
The AVAX hourly chart is currently demonstrating a potential ‘Triple Top’ pattern, a bearish signal, as at 2023-12-10 14:00:00. Starting from a price point of $31.07 on 2023-12-09 06:00:00, the asset recorded significant peaks at $34.26, $31.27, and $34.25 respectively, before returning to $31.52. The pattern’s formation, still incomplete, suggests an entry point at $31.6033 with a predicted profit objective at 24.54%. However, caution is advised due to a potential stop loss at $38.662. It’s essential to monitor this development as the pattern matures.
About AVAX
Avalanche (AVAX) is a cryptocurrency launched in 2020. Avalanche has a current supply of 433,787,434.8566502 with 365,754,524.8566502 in circulation. The last known price of Avalanche is 35.58 USD and is up 8.70 over the last 24 hours. It is currently trading on 584 active market(s) with $2,795,313,881.56 traded over the last 24 hours. More information can be found at https://avax.network/.
For more chart patterns, trading signals, and crypto data, download our app in the Appstore or Playstore: Download Now