Welcome to today’s edition of our chart pattern alerts. Again, we put together some promising chart patterns currently forming on the hourly or daily chart. Browse and get some trading ideas.
For more chart patterns, trading signals, and crypto data, download our app in the Appstore or Playstore: Download Now
DOGE – Triangle identified Chart Pattern Alert(1H)
Chart Pattern Information
A potential ‘Triangle’ pattern is currently building up on the hourly chart of DOGE. As of 11:00 AM, 11th December 2023, the asset price stood at 0.09937, decreasing to 0.09106 by 18:00 PM the same day, and then recovering to 0.09802 by 03:00 AM on 12th December, before marginally declining to 0.09462 by 06:00 AM. Anticipated intersection is at about 0.09707 at 13:00 PM. Please be reminded that the formation of this pattern is an ongoing process and status remains incomplete.
About DOGE
Dogecoin (DOGE) is a cryptocurrency . Users are able to generate DOGE through the process of mining. Dogecoin has a current supply of 142,200,426,383.7052. The last known price of Dogecoin is 0.0972 USD and is down -0.29 over the last 24 hours. It is currently trading on 839 active market(s) with $1,209,251,694.86 traded over the last 24 hours. More information can be found at http://dogecoin.com/.

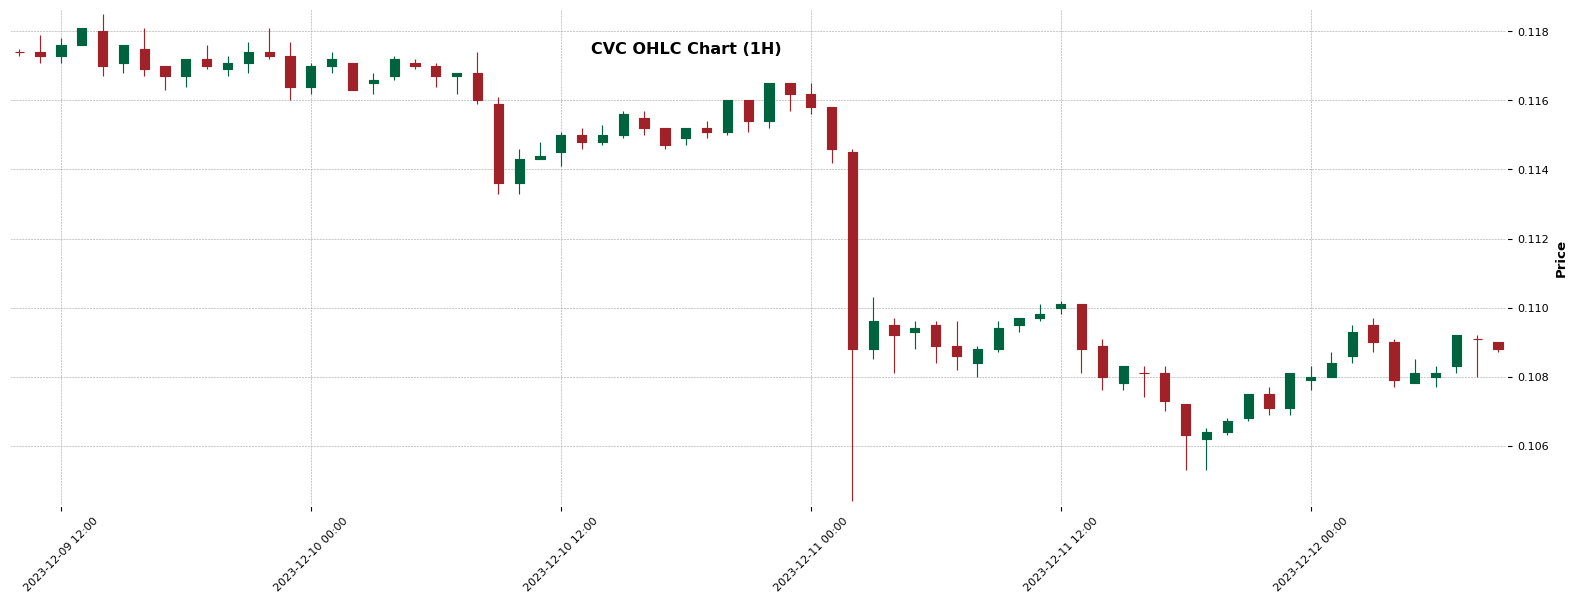
CVC Chart Pattern Alert – Triangle identified (1H)
Chart Pattern Information
An emerging triangle pattern is noted in the hourly chart data of CVC. Commenced at 0.1102 on 11th December 2023 at 12:00, the price dipped to 0.1053 by 18:00 the same day. Subsequently, a slight increase to 0.1097 by 03:00 on the December 12th, but a decrease to 0.1077 again by 06:00 that day. The intersection point is at 0.10933, expected around 13:00 on the 12th December. Despite being a mature pattern, its specific subtype remains unknown. Status of this pattern is incomplete, indicating this trend is still in development. This data analysis does not provide entry, profit, or stop-loss points.
About CVC
Civic (CVC) is a cryptocurrency and operates on the Ethereum platform. Civic has a current supply of 1,000,000,000. The last known price of Civic is 0.1088 USD and is up 0.17 over the last 24 hours. It is currently trading on 128 active market(s) with $9,782,000.86 traded over the last 24 hours. More information can be found at https://www.civic.com/.
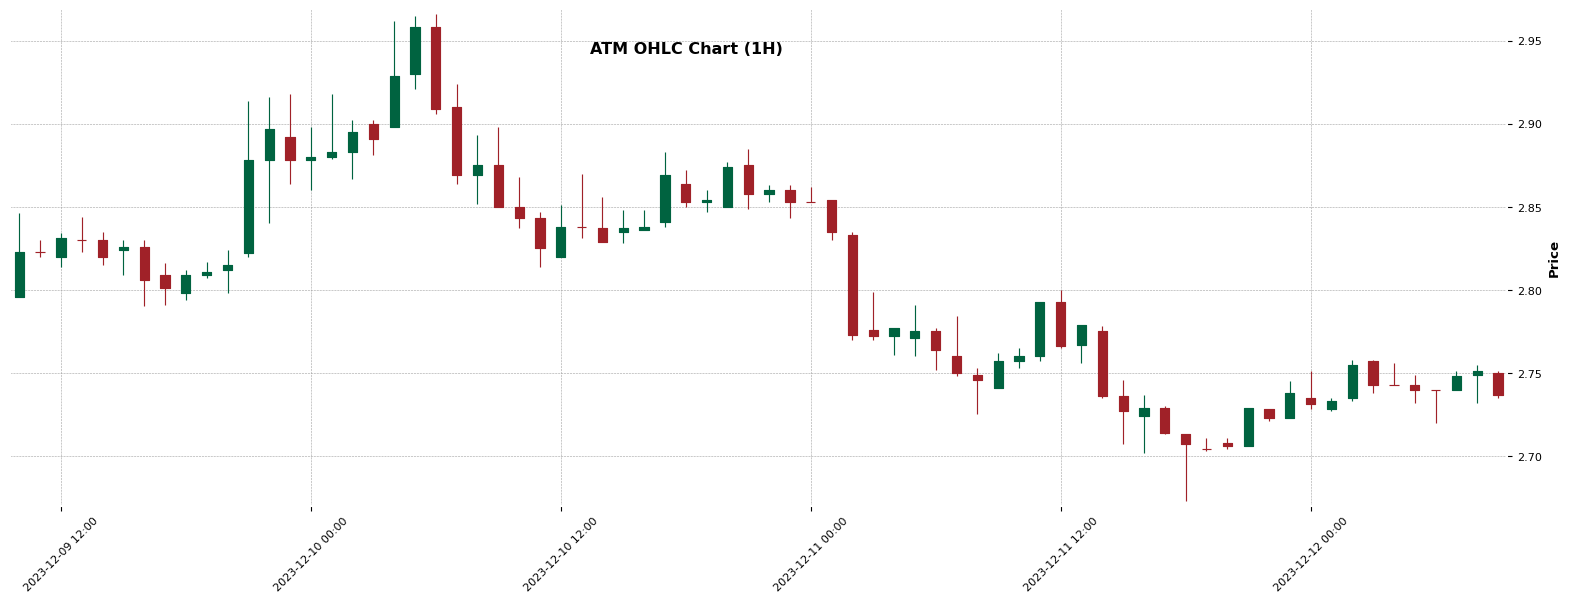
ATM – Double Bottom identified (1H)
Chart Pattern Information
The hourly chart for ATM is starting to exhibit signs of a potentially bullish “Double Bottom” pattern currently taking shape. This pattern began forming on 11th December 2023, at 02:00 when the price was at 2.8. It registered a drop to 2.725 at 08:00, followed by a slight rise to 2.8 at 12:00 and then a dip to 2.673 at 18:00. As of 12th December 2023, 08:00, the price has again reached 2.8, signalling the second bottom in this developing pattern. Please note, this feature is still in progress, and it has a potential profit of 2.927 with a stop loss at 2.6603.
About ATM
Atletico De Madrid Fan Token (ATM) is a cryptocurrency and operates on the Chiliz platform. Atletico De Madrid Fan Token has a current supply of 10,000,000 with 3,929,282 in circulation. The last known price of Atletico De Madrid Fan Token is 2.741 USD and is down -0.03 over the last 24 hours. It is currently trading on 43 active market(s) with $1,254,605.38 traded over the last 24 hours. More information can be found at https://www.socios.com/atletico-de-madrid/.

Crypto Chart Pattern Alerts — 11th December 2023 (AVAX, BNB, ALGO, and many more)
Crypto Chart Pattern Alerts, 9th December 2023
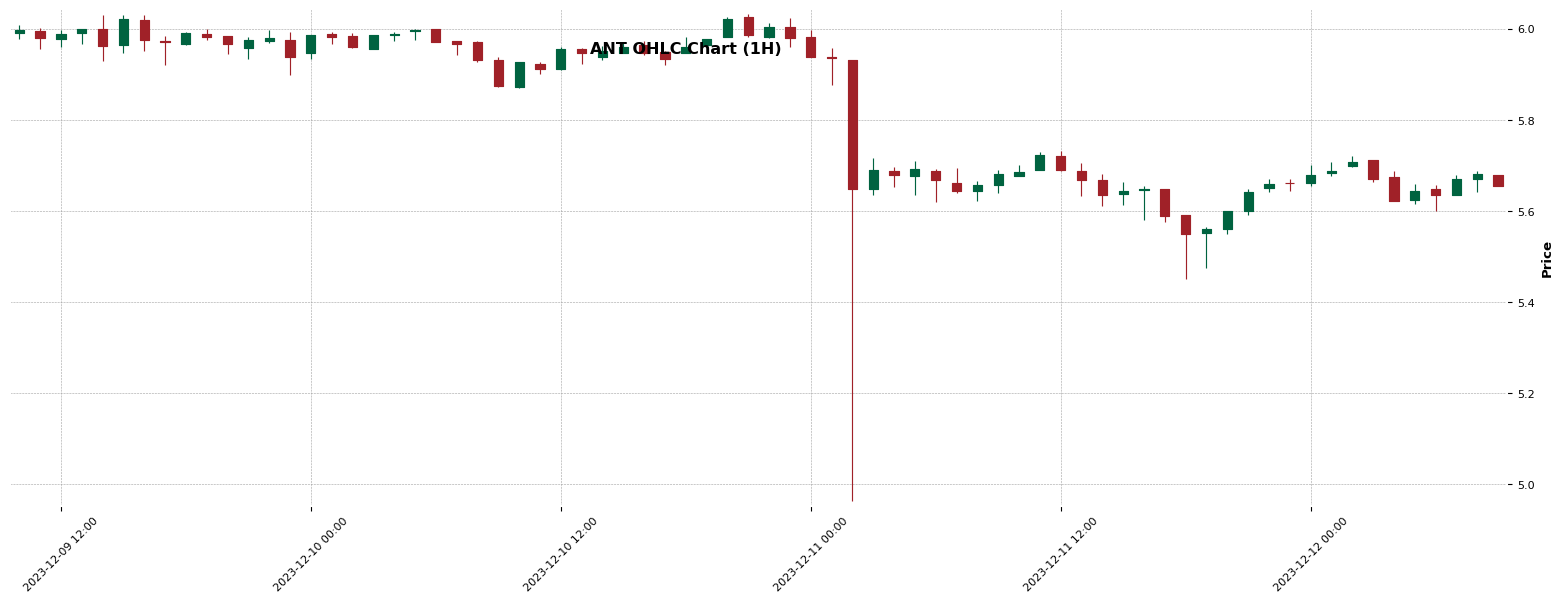
ANT – Triangle Chart Pattern identified (1H)
Chart Pattern Information
As of the time stamp of 12:00 on 11th December 2023, the hourly chart of ANT appears to be forming a ‘Triangle’ pattern. The pattern started to emerge at a price point of 5.732, with a subsequent decrease to 5.451 by 18:00 on the same day. By 02:00 on the 12th December 2023, the price nearly regained its former value at 5.721, but then descended slightly to 5.601 by 06:00. It’s predicted to intersect at roughly 5.71 around 13:00. Please note, this pattern is incomplete and its specificity is currently undetermined. Detailed analysis will be feasible once it matures.
About ANT
Aragon (ANT) is a cryptocurrency and operates on the Ethereum platform. Aragon has a current supply of 43,176,160.11504921. The last known price of Aragon is 5.661 USD and is up 0.25 over the last 24 hours. It is currently trading on 162 active market(s) with $11,341,057.01 traded over the last 24 hours. More information can be found at https://aragon.org/.
ADX – Double Bottom identified (1H)
Chart Pattern Information
The ADX is currently forming an intriguing “Double Bottom” bullish pattern on the hourly chart. This chart pattern began forming on Dec 11, 2023 at 02:00:00 with a start price of 0.1762. The price fluctuated throughout the day, reaching figures as low as 0.1656 at 06:00:00 and peaking at 0.1762 by 13:00:00. As of 08:00:00 on Dec 12, the pattern is still incomplete with an end price at 0.1762. If the pattern matures and the entry point of 0.1762 is reached, a first potential profit could be 0.1868. Please note, the stop loss is set at 0.1645.
About ADX
AdEx (ADX) is a cryptocurrency and operates on the Ethereum platform. AdEx has a current supply of 150,000,000 with 142,557,533.66 in circulation. The last known price of AdEx is 0.1742 USD and is up 3.46 over the last 24 hours. It is currently trading on 59 active market(s) with $4,322,250.09 traded over the last 24 hours. More information can be found at https://www.adex.network/.

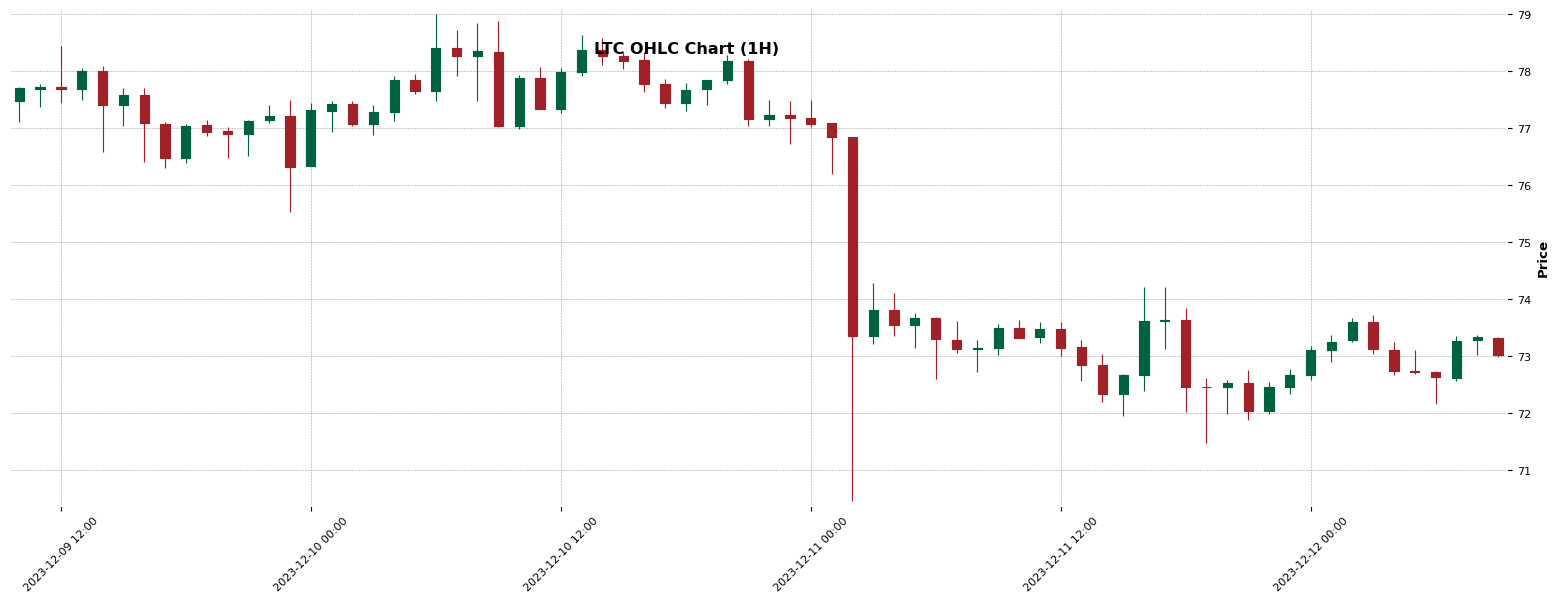
LTC – Double Bottom pattern identified on the daily chart (1D)
Chart Pattern Information
An interesting pattern is currently forming in the hourly chart of LTC. The pattern, known as a ‘Double Bottom’, indicates a bullish trend. OBSERVATION: The pattern starts with LTC valued at $74.22 at 4:00 AM on December 11, 2023. It dips to $71.94, rallies back to $74.22, then falls again to $71.47 by the evening of that same day. This pattern suggests that if the price reaches its entry point again at $74.22, it may potentially surge up to the profit marker of $76.97. However, bear in mind, it’s still incomplete. An insightful reminder to keep a vigilant watch.
About LTC
Litecoin (LTC) is a cryptocurrency . Users are able to generate LTC through the process of mining. Litecoin has a current supply of 84,000,000 with 73,972,789.08259039 in circulation. The last known price of Litecoin is 73.12 USD and is down -0.06 over the last 24 hours. It is currently trading on 1061 active market(s) with $425,558,283.75 traded over the last 24 hours. More information can be found at https://litecoin.org/.
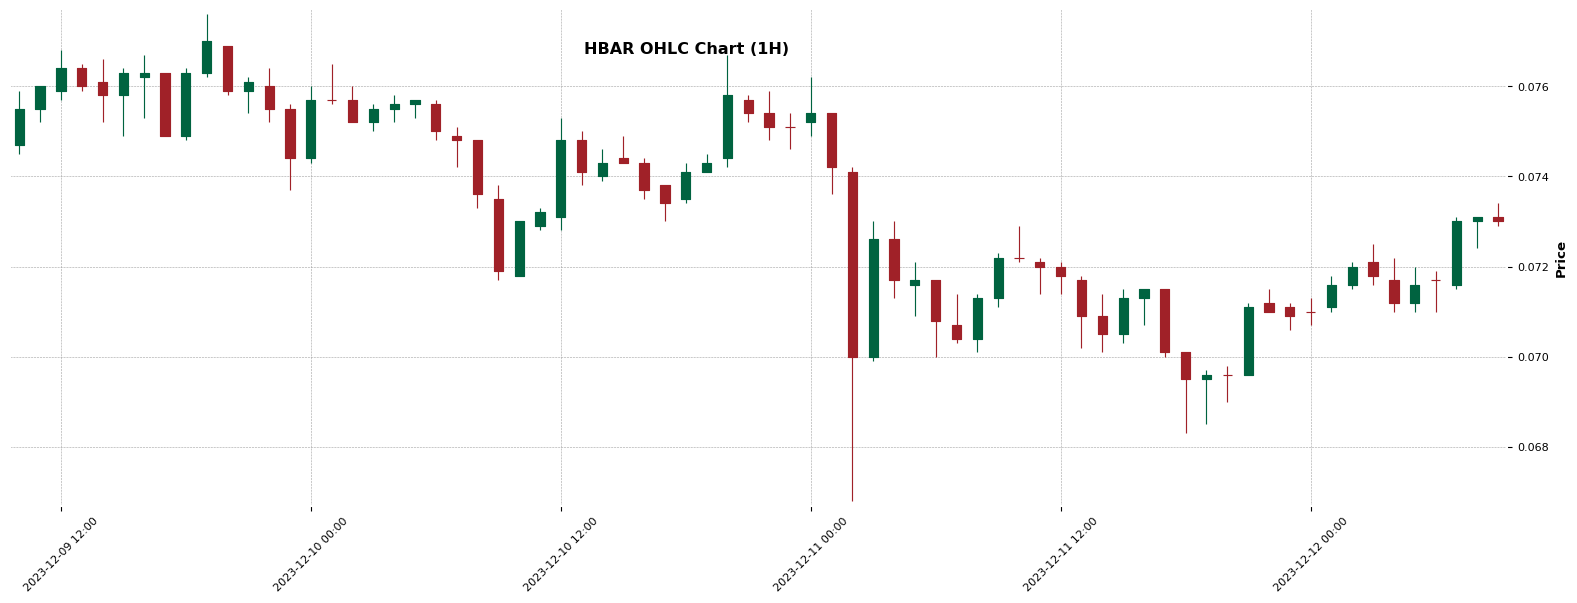
HBAR – Double Bottom pattern identified on the daily chart (1D)
Chart Pattern Information
The HBAR hourly chart shows a potential bullish pattern forming, referred to as a ‘Double Bottom’. Since 05:00 on December 11th, 2023, the price has fluctuated between 0.07 and 0.0729, signalling the formation of this pattern. However, this pattern remains incomplete and needs to mature before making entry at 0.0729. The projected profit from this pattern is 0.0775, with a stop loss at 0.0678 to limit downside. As with any trade, caution is advised until the chart pattern successfully completes. We will continue monitoring the developments until 08:00 on December 12th, 2023.
About HBAR
Hedera (HBAR) is a cryptocurrency launched in 2017. Hedera has a current supply of 50,000,000,000 with 33,576,848,010.229717 in circulation. The last known price of Hedera is 0.072 USD and is up 2.48 over the last 24 hours. It is currently trading on 200 active market(s) with $75,713,849.72 traded over the last 24 hours. More information can be found at https://www.hedera.com/.
ATM – Double Bottom identified (1D)
Chart Pattern Information
A potential bullish ‘Double Bottom’ pattern is currently in the process of forming on the hourly ATM chart as of 2023-12-11. At 03:00, the pattern started forming initially with a price of 2.8, dipping to 2.725 by 09:00, and then hitting 2.8 again at 13:00. The pattern saw a subsequent dip to 2.673 at 19:00. The chart suggests entry at 2.8 with a proposed stop-loss at 2.6603. The pattern offers a potential profit target of 2.927. Please be advised, the pattern formation yet remains incomplete, and these figures are subject to change as they mature.
About ATM
Atletico De Madrid Fan Token (ATM) is a cryptocurrency and operates on the Chiliz platform. Atletico De Madrid Fan Token has a current supply of 10,000,000 with 3,929,282 in circulation. The last known price of Atletico De Madrid Fan Token is 2.741 USD and is down -0.03 over the last 24 hours. It is currently trading on 43 active market(s) with $1,254,605.38 traded over the last 24 hours. More information can be found at https://www.socios.com/atletico-de-madrid/.
For more chart patterns, trading signals, and crypto data, download our app in the Appstore or Playstore: Download Now