Welcome to today’s edition of Crypto Chart Pattern Alerts. This time, we had a look at the daily chart and found some promising patterns for tokens, such as CAKE, STEEM, or Tron (TRX). Let’s dive right into it!
For more chart patterns, trading signals, and crypto data, download our app in the Appstore or Playstore: Download Now
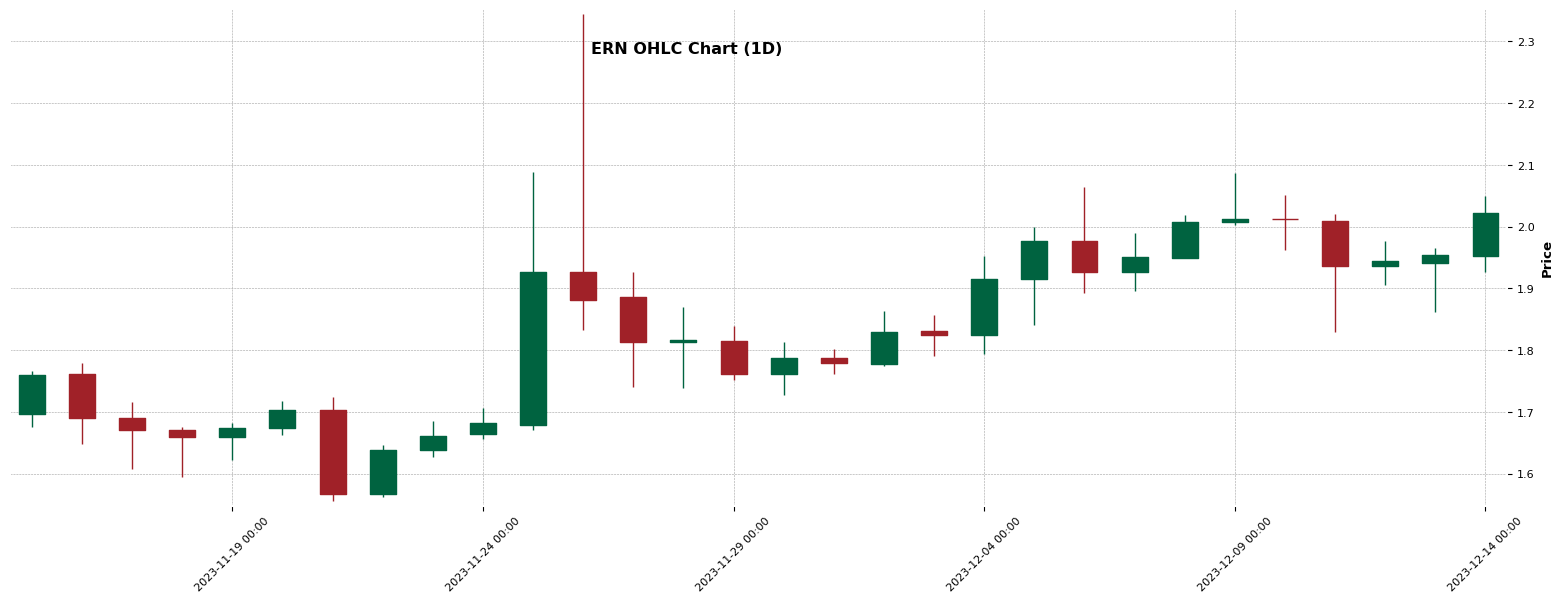
ERN – Triangle identified (1D)
Chart Pattern Information
The daily chart of ERN is in the process of forming a potential Triangle pattern. As of now, this pattern remains incomplete, having started building on November 26, 2023, when the asset price was $2.344. It hit a low on November 30 at $1.727 before bouncing back to $2.087 on December 9. The asset price then dipped to $1.83 on December 11. It’s expected to intersect at an estimated price of $1.89 around December 17, 2023. The nature of this pattern is currently unknown. Profit expectations and stop-loss details are yet to be provided.
About ERN
Ethernity (ERN) is a cryptocurrency launched in 2021and operates on the Ethereum platform. Ethernity has a current supply of 30,000,000 with 19,966,205.23477988 in circulation. The last known price of Ethernity is 2.01 USD and is up 5.23 over the last 24 hours. It is currently trading on 60 active market(s) with $2,609,045.33 traded over the last 24 hours. More information can be found at https://ethernity.io/.
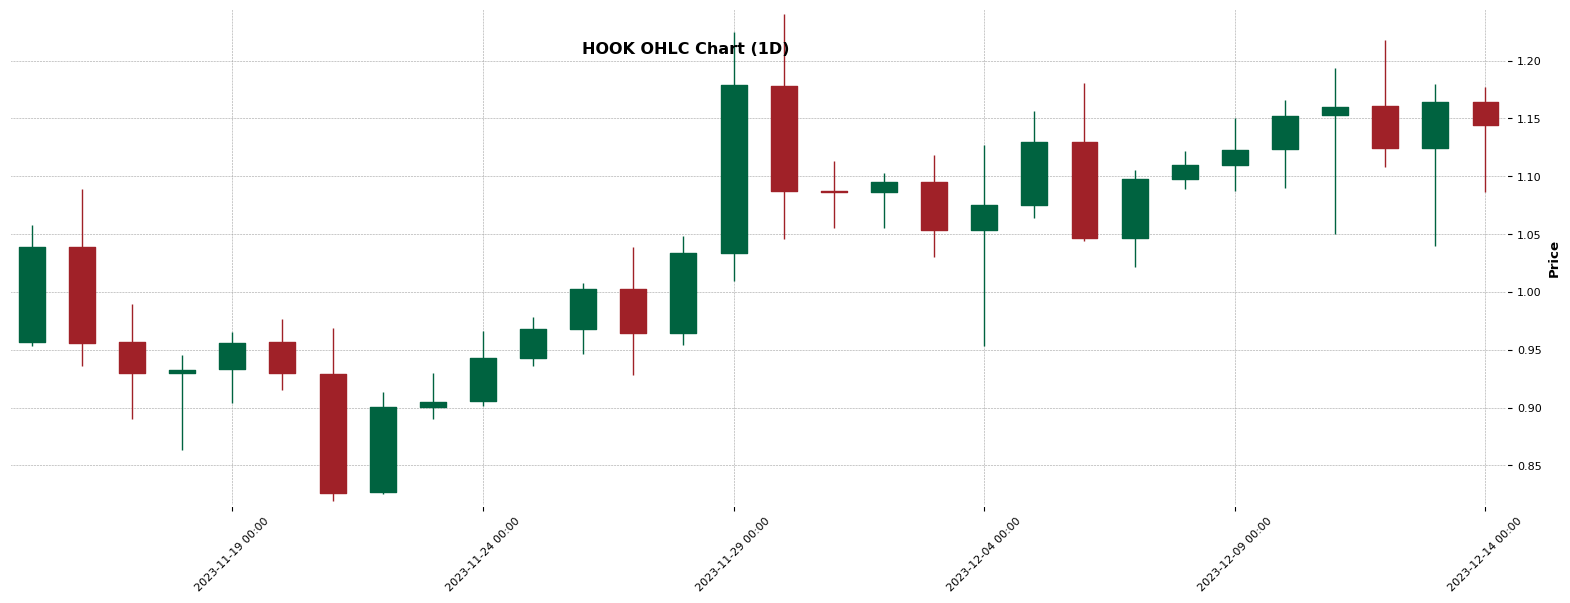
HOOK – Double Top identified (1D)
Chart Pattern Information
A potentially bearish ‘Double Top’ pattern is currently developing on the daily chart of HOOK. This pattern began taking shape on November 27, 2023, when the price was at $0.9529. The pattern moved through a high of 1.24 on November 30, dipped to $0.9529 on December 4, and rebounded to 1.2175 on December 12. The current status of the pattern is incomplete, indicating further potential price movements before it’s complete. This chart pattern has a stop loss at $1.268 and a profit target of $0.6658 if the pattern matures. Please remember, chart pattern formation is not a guarantee of future price direction.
About HOOK
Hooked Protocol (HOOK) is a cryptocurrency and operates on the BNB Smart Chain (BEP20) platform. Hooked Protocol has a current supply of 500,000,000 with 106,801,377.07590568 in circulation. The last known price of Hooked Protocol is 1.14 USD and is up 1.91 over the last 24 hours. It is currently trading on 79 active market(s) with $15,475,008.39 traded over the last 24 hours. More information can be found at https://hooked.io/.
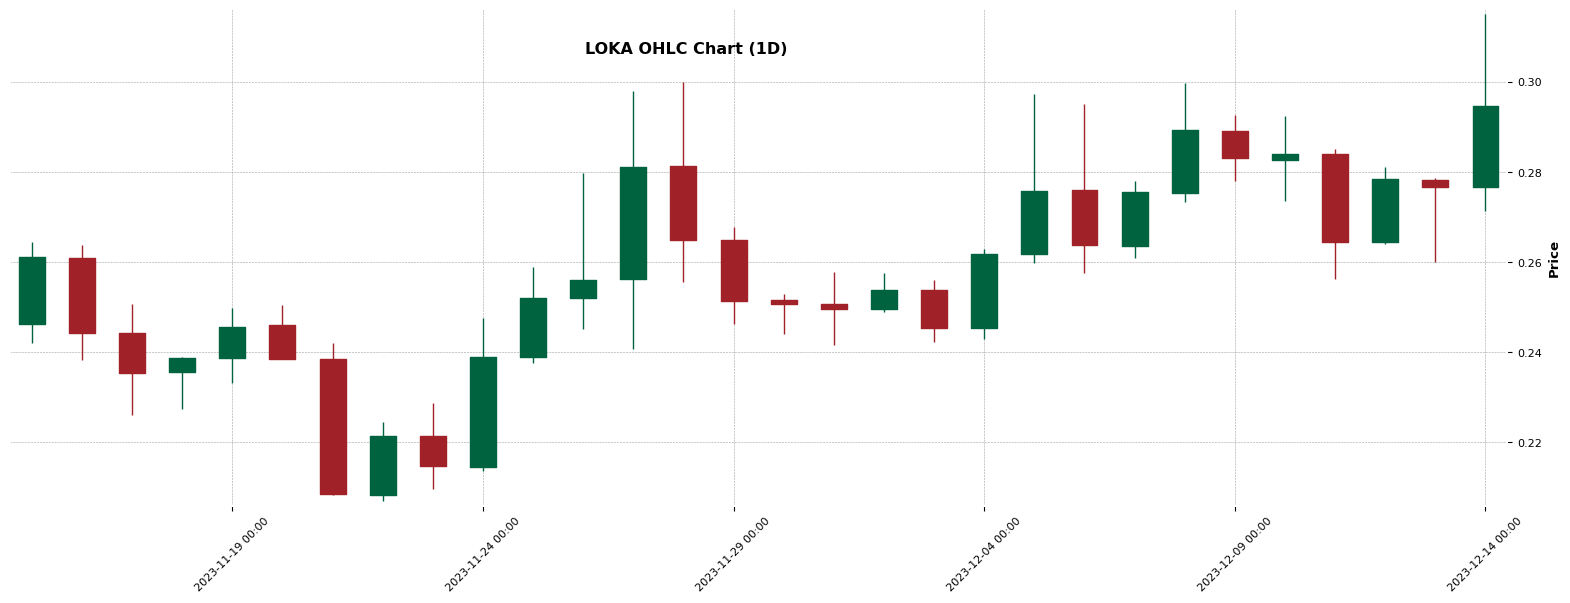
LOKA – Double Top identified (1D)
Chart Pattern Information
The daily chart of LOKA shows a potential ‘Double Top’ pattern unfolding, indicating a bearish market. Initiated from a price of $0.2417 on Nov 27, 2023, it peaked at $0.3 on Nov 28, 2023, then dipped to $0.2417 on Dec 1, 2023, and rebounded to 0.2998 on Dec 8, 2023. This pattern is still forming and is expected to complete by Dec 14, 2023. The status is currently ‘incomplete’. The entry point stands at 0.2417 and the proposed stop loss is at 0.3058. The first projected profit level is at $0.1834. This data serves as a guide for trade decisions.
About LOKA
League of Kingdoms Arena (LOKA) is a cryptocurrency launched in 2022and operates on the Ethereum platform. League of Kingdoms Arena has a current supply of 197,769,307.41927272 with 73,874,861.14654545 in circulation. The last known price of League of Kingdoms Arena is 0.29 USD and is up 10.74 over the last 24 hours. It is currently trading on 54 active market(s) with $7,507,520.81 traded over the last 24 hours. More information can be found at https://www.leagueofkingdoms.com/.
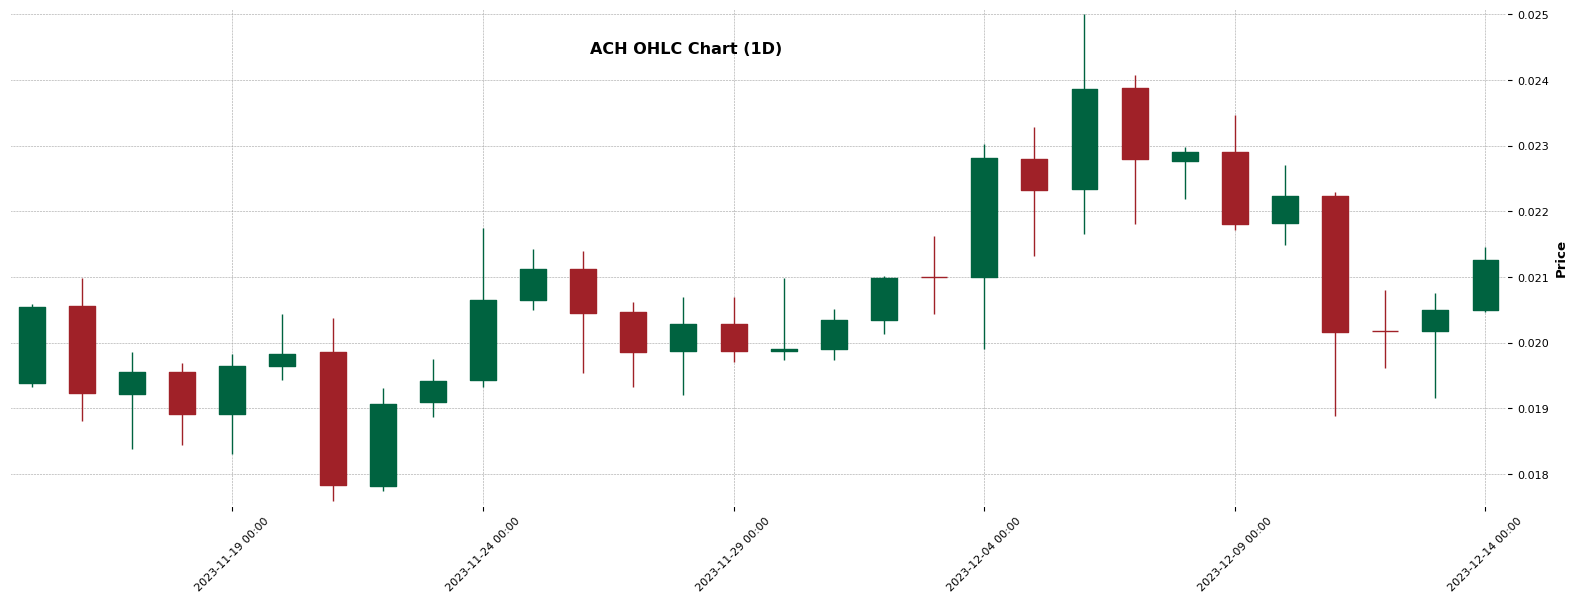
ACH – Double Top identified (1D)
Chart Pattern Information
The daily chart of ACH currently indicates a developing chart pattern, known as a ‘Double Top’ – a bearish indication which suggests a potential reversal in the market trend. The pattern began forming on 2023-11-09, with an initial price of $0.01759, rising to $0.02364 by 2023-11-10. A subsequent drop to $0.01759 by 2023-11-21 was followed by a slight rise to 0.025 by 2023-12-06. The pattern, however, remains unfinished as of 2023-12-14, with the end price at 0.01759. Investors should be prepared for potential declines, with a recommended entry at $0.0176 and stop loss position at 0.0257.
About ACH
Alchemy Pay (ACH) is a cryptocurrency and operates on the Ethereum platform. Alchemy Pay has a current supply of 9,999,999,999.999989 with 7,082,904,164.955263 in circulation. The last known price of Alchemy Pay is 0.021 USD and is up 5.42 over the last 24 hours. It is currently trading on 162 active market(s) with $16,193,865.52 traded over the last 24 hours. More information can be found at https://alchemypay.org/.
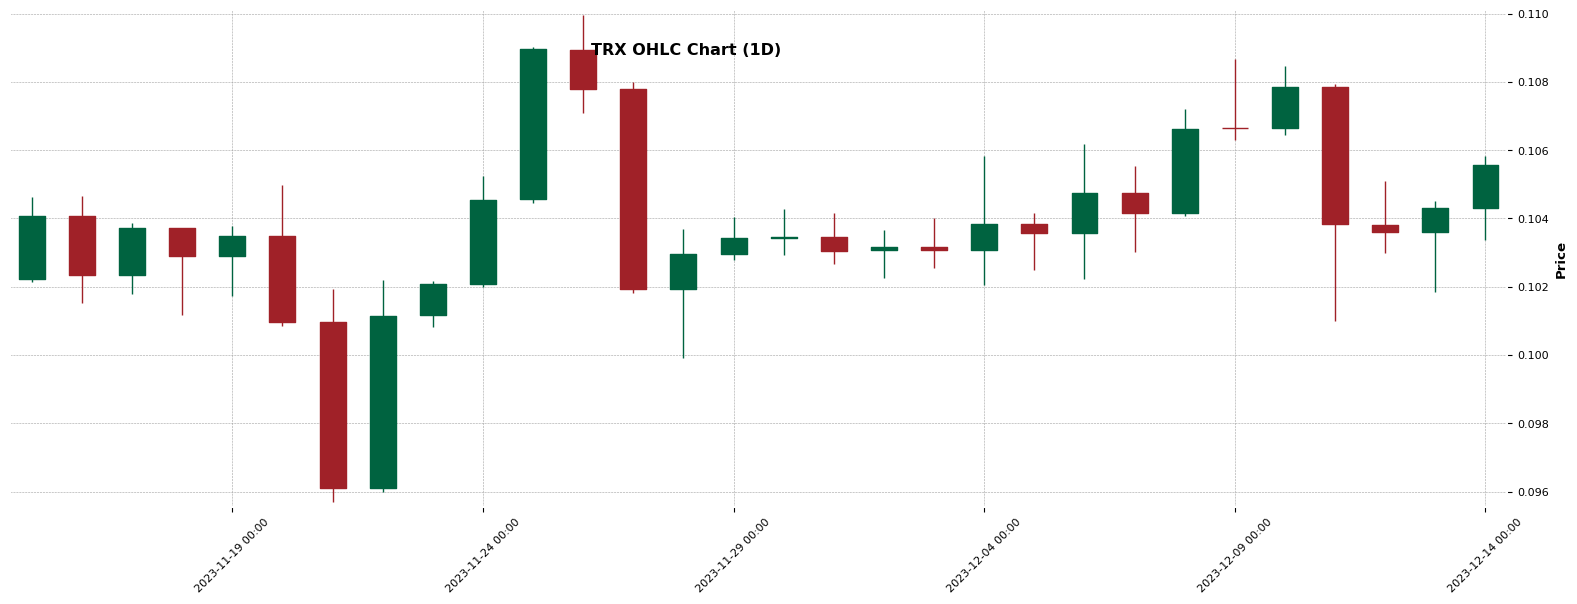
TRX – Double Top identified (1D)
Chart Pattern Information
The TRX is currently forming a bearish “Double Top” pattern on its daily chart. Starting on October 31, 2023, with an entry price of 0.0957, it climbed to a peak of $0.113 on November 10, then dropped and rose again to a lower high of $0.1099 on November 26. By December 14, 2023, the pattern is still incomplete with TRX back to its initial price of 0.0957. This suggests potential downward pressure on the asset. However, investors should watch out for any changes as the pattern continues to mature.
About TRX
TRON (TRX) is a cryptocurrency. TRON has a current supply of 88,428,749,325.50311 with 88,428,718,230.3445 in circulation. The last known price of TRON is 0.105 USD and is up 2.35 over the last 24 hours. It is currently trading on 887 active market(s) with $259,877,289.43 traded over the last 24 hours. More information can be found at https://tron.network/.
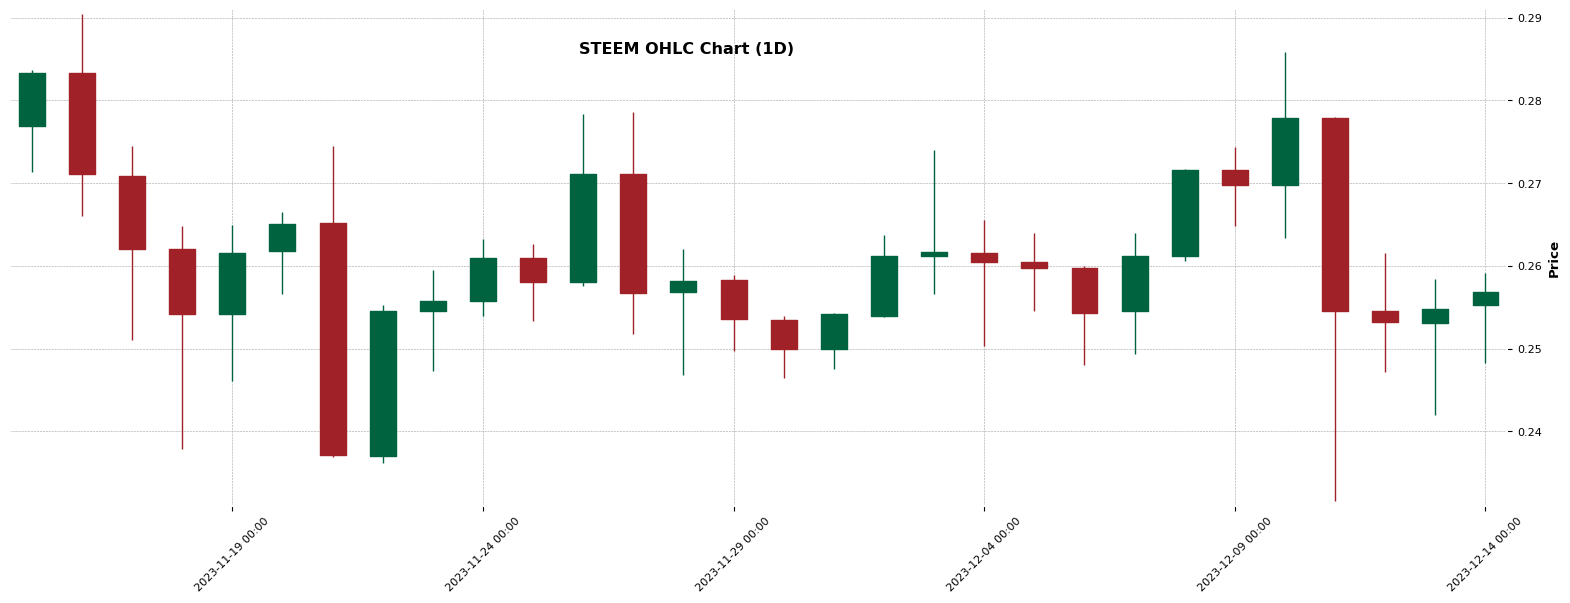
STEEM – Wedge identified (1D)
Chart Pattern Information
As of now, a chart pattern is gradually taking shape in the daily chart of STEEM. The pattern, identified as ‘Wedge’, started to form on November 14th, 2023, when STEEM was priced at $0.3253. Thereafter, it fell to $0.2362 by November 22nd, climbed to $0.2859 by December 10th, and dropped again to $0.2316 the following day. This ‘Wedge’ is expected to intersect at $0.2216 on January 20th, 2024. The pattern’s development isn’t finished yet, and due to its undefined nature, potential profits, entry points, and stop losses are yet to be ascertained.
About STEEM
Steem (STEEM) is a cryptocurrency . Steem has a current supply of 450,762,981.165. The last known price of Steem is 0.257 USD and is up 2.20 over the last 24 hours. It is currently trading on 55 active market(s) with $6,146,884.26 traded over the last 24 hours. More information can be found at https://steem.com/.
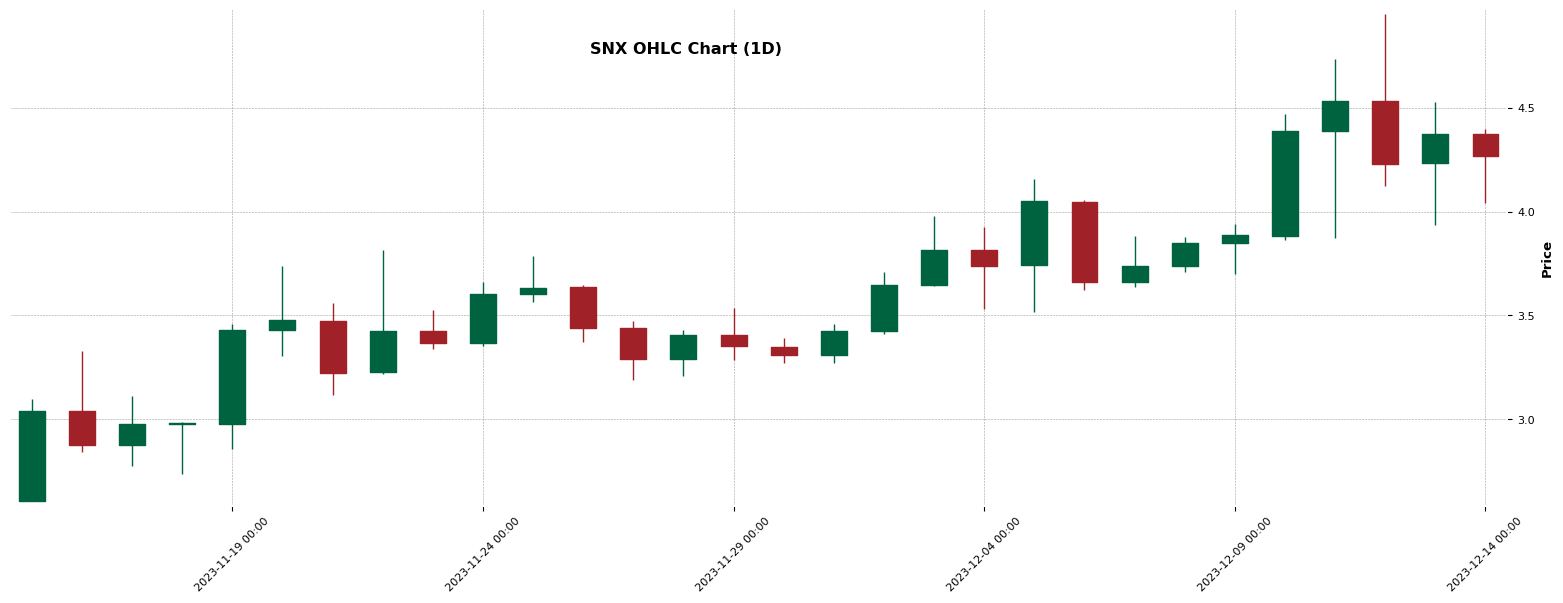
SNX – Triple Top identified (1D)
Chart Pattern Information
The SNX daily chart appears to be in the process of forming a ‘Triple Top’ pattern. This bearish pattern kicked off on 2023-11-11 01:00:00 with a starting price of 2.3824, reached a high of 3.813 on 2023-11-22 01:00:00, and is projected to close around 3.4371 on 2023-12-02 01:00:00. The formation of this pattern suggests potential for a downtrend. However, the status of the pattern is still ‘incomplete’ as of the latest data, meaning it has yet to mature. A firm prognosis requires monitoring for closure above the stoploss level of 5.1727. Keep these factors in mind when considering adjustments to your SNX trading strategy.
About SNX
Synthetix (SNX) is a cryptocurrency and operates on the Ethereum platform. Synthetix has a current supply of 328,193,104.0887736 with 300,850,434.52833575 in circulation. The last known price of Synthetix is 4.27 USD and is down -0.76 over the last 24 hours. It is currently trading on 531 active market(s) with $108,801,390.07 traded over the last 24 hours. More information can be found at https://www.synthetix.io/.
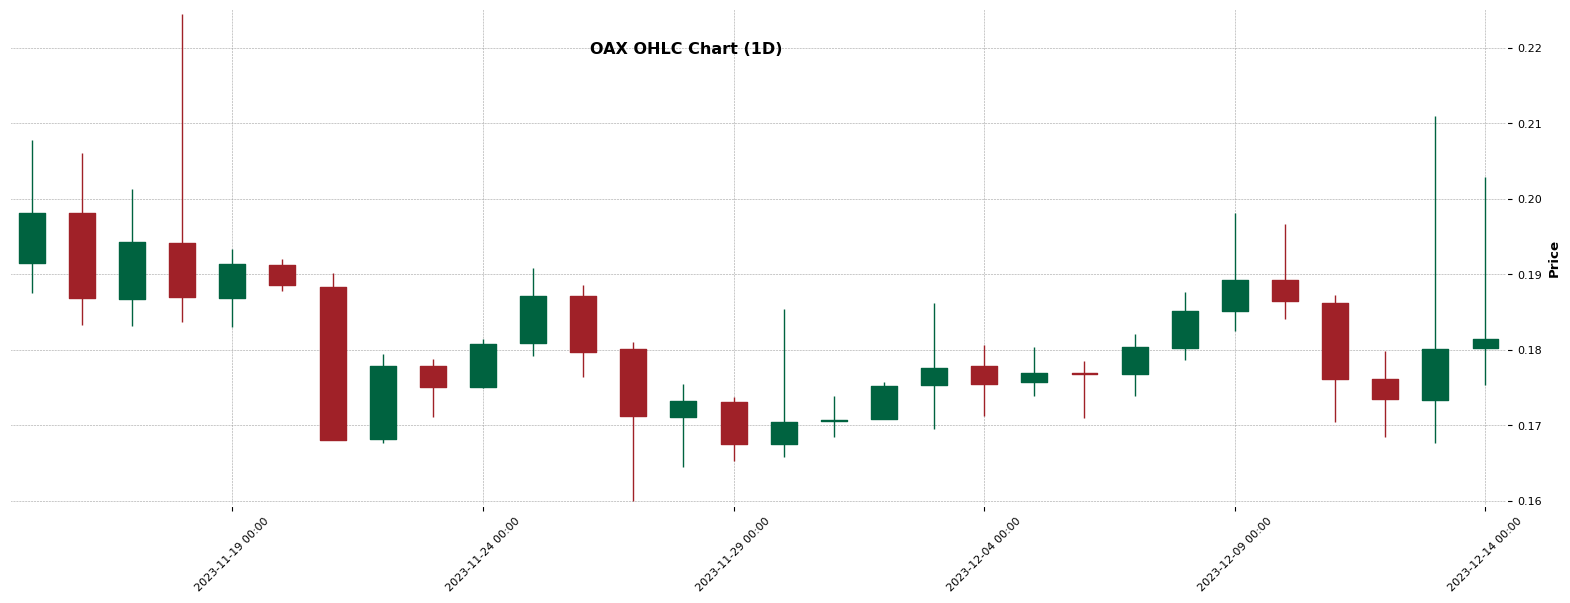
OAX – Triple Top identified (1D)
Chart Pattern Information
The OAX daily chart appears to be shaping a bearish ‘Triple Top’ pattern, currently in progress. The pattern started forming on ‘2023-09-07’, with a starting price of approximately 0.1424. With peaks observed on ‘2023-09-12’, ‘2023-09-17’ and ‘2023-09-29’, prices ranged from 0.1428 to 0.2135. The incomplete status indicates the pattern’s maturity has not yet been reached, with the chart proposing an entry point at 0.144, and a potential profit of 0.0113. However, it also flags a stop-loss point at 0.2767, should market dynamics shift unfavorably. It’s crucial to monitor the pattern development for investment decisions.
About OAX
OAX (OAX) is a cryptocurrency and operates on the Ethereum platform. OAX has a current supply of 100,000,000 with 77,028,691.13784318 in circulation. The last known price of OAX is 0.181 USD and is up 1.07 over the last 24 hours. It is currently trading on 20 active market(s) with $9,518,994.14 traded over the last 24 hours. More information can be found at https://oax.org/.
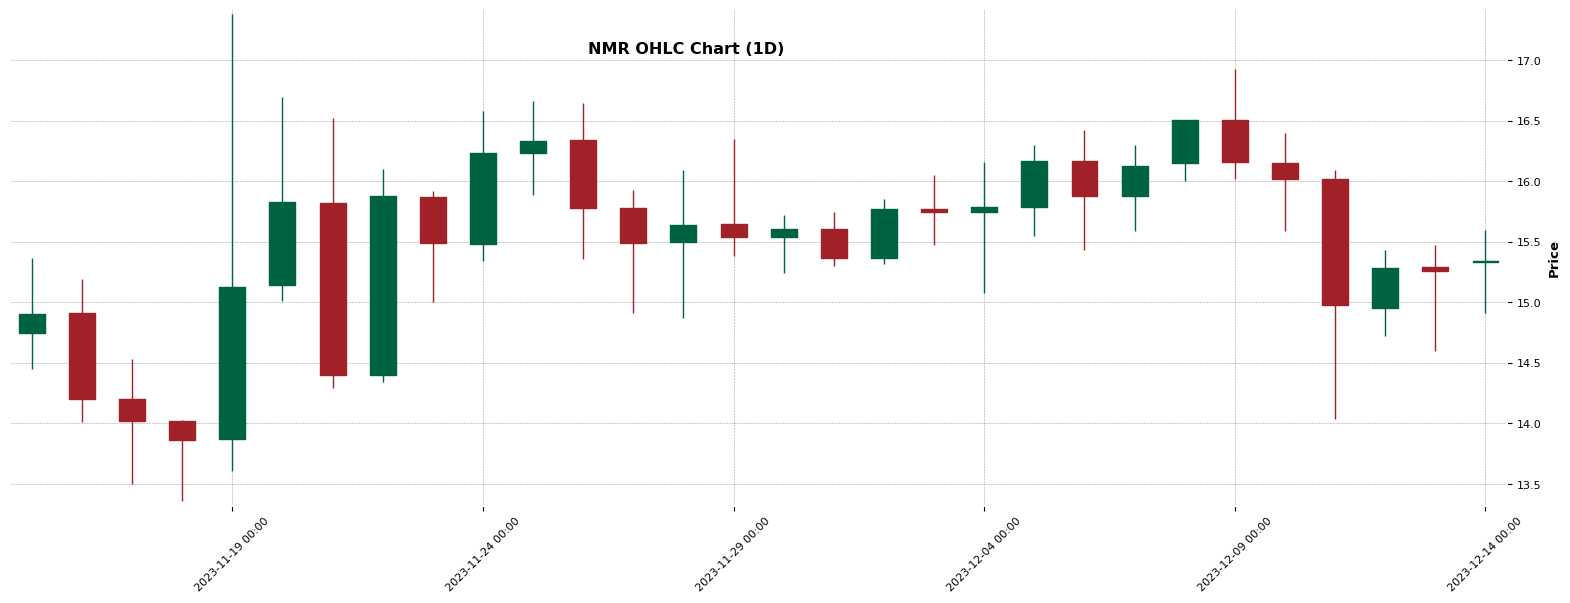
NMR – Double Top identified (1D)
Chart Pattern Information
As per the recent NMR data, a ‘Double Top’ bearish chart pattern is currently forming on the daily chart. On November 9, 2023, the share started trading at $13.36, reaching a high of $15.81 on November 13. It then experienced a slight dip to $13.36 by November 18, before climbing back up to $17.38 the next day. A potential entry point is $13.36 with a stop loss at $17.782, indicating a bearish trend. The pattern, however, is noted as incomplete as of December 14, and investors should keep a close eye for the pattern maturation to optimise the strategy.
About NMR
Numeraire (NMR) is a cryptocurrency and operates on the Ethereum platform. Numeraire has a current supply of 10,793,755.06365722 with 6,126,090.22577892 in circulation. The last known price of Numeraire is 15.39 USD and is up 1.43 over the last 24 hours. It is currently trading on 133 active market(s) with $8,792,536.14 traded over the last 24 hours. More information can be found at https://numer.ai/.
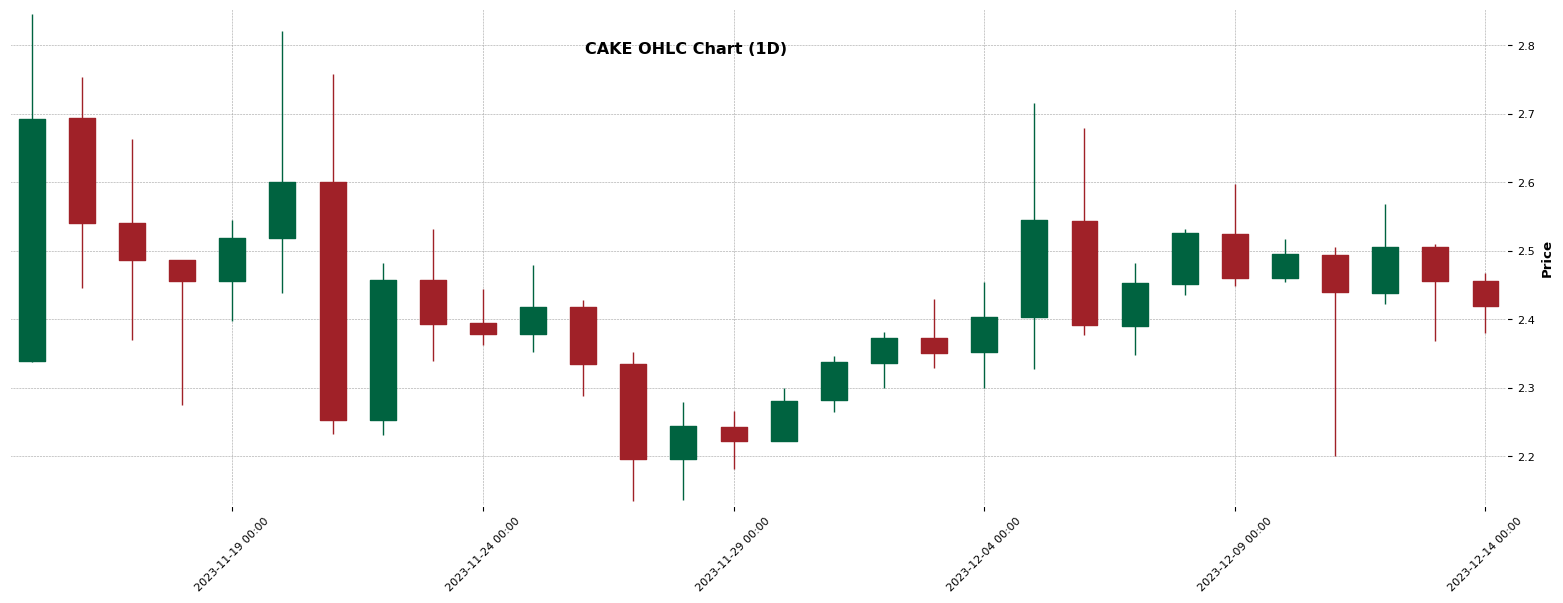
CAKE – Triangle identified (1D)
Chart Pattern Information
The data indicates a potential Triangle pattern forming on the daily chart for CAKE. As of December 11, 2023, the price is recorded at 2.2. However, this is an incomplete pattern with its maturity status marked as 1. The intersection price, projected for January 19, 2024, is expected to be around 2.39. Please note that this pattern is still in progress and investors should monitor the situation closely. Also, as the pattern type is unknown, one should practice extra caution concerning entry, profit, and stop-loss decisions. As always, this information is subject to change based on market conditions.
About CAKE
PancakeSwap (CAKE) is a cryptocurrency and operates on the Ethereum platform. PancakeSwap has a current supply of 388,278,170.2781238 with 263,679,698.37864822 in circulation. The last known price of PancakeSwap is 2.427 USD and is up 0.86 over the last 24 hours. It is currently trading on 1228 active market(s) with $86,891,866.34 traded over the last 24 hours. More information can be found at https://pancakeswap.finance/.
For more chart patterns, trading signals, and crypto data, download our app in the Appstore or Playstore: Download Now