Welcome to today’s edition of Crypto Chart Pattern Alerts. This time, we looked at the hourly chart and found some promising patterns for tokens, such as STX, VET, or AGIX. Let’s dive right into it!
For more chart patterns, trading signals, and crypto data, download our app in the Appstore or Playstore: Download Now
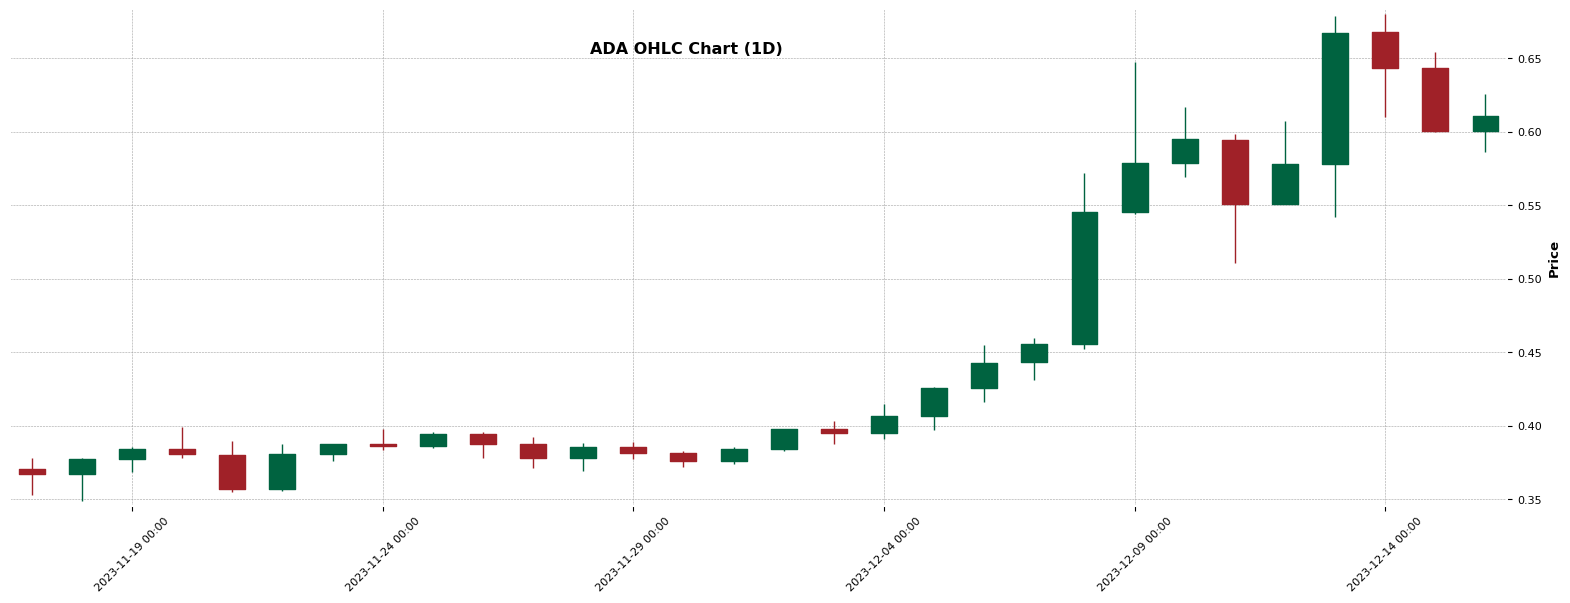
ADA – Double Top identified (1H)
Chart Pattern Information
As of now, an intriguing ‘Double Top’ pattern seems to be forming on the hourly chart of ADA. This bearish pattern started emerging on December 13, 2023, at 17:00 with an entry price of 0.61. It reached a high point of 0.68 on December 14 but dropped back to 0.61 after 13 hours. The price rebounded to 0.6541 by December 15. This pattern is still incomplete, indicating potential downtrends in the ADA market. It’s essential to note that a stop-loss level is set at 0.687, reflecting risk management strategies. Recalling the pattern’s bearish nature, the suggested profit level could drop to 0.54.
About ADA
Cardano (ADA) is a cryptocurrency launched in 2017. Cardano has a current supply of 36,439,975,031.087 with 35,337,396,620.262 in circulation. The last known price of Cardano is 0.608 USD and is down -1.57 over the last 24 hours. It is currently trading on 1004 active market(s) with $700,679,509.93 traded over the last 24 hours. More information can be found at https://www.cardano.org.
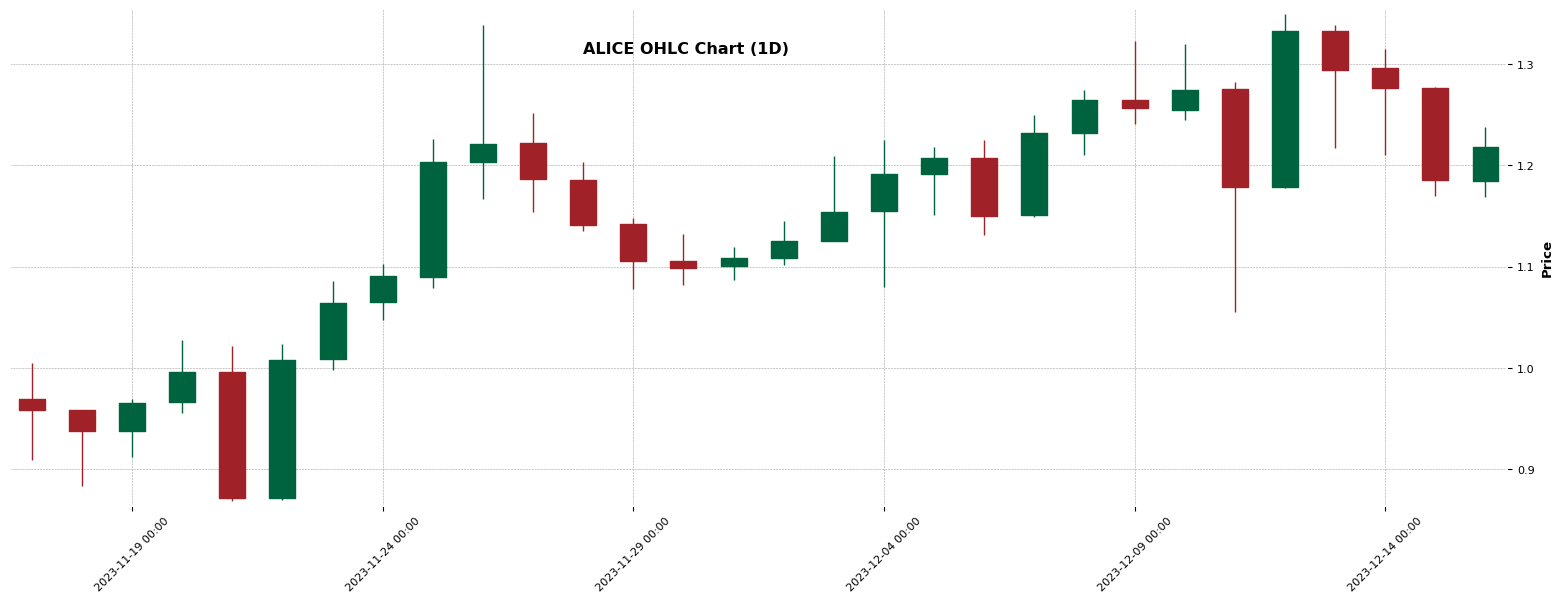
ALICE – Triangle identified (1H)
Chart Pattern Information
A triangle pattern is currently in the process of forming on the hourly ALICE chart. The pattern began to take shape on December 12, 2023 at 17:00 when the price was at 1.219. It then peaked at 1.349 by 23:00 the same day and, after a dip at 7:00 the following morning, improved to 1.314 by 10:00. The intersection price is 1.2367 and the pattern is expected to mature by 9:00, December 14, 2023. It’s noteworthy that since this pattern is in progress, its type and potential impacts are yet to be determined.
About ALICE
MyNeighborAlice (ALICE) is a cryptocurrency launched in 2021and operates on the Ethereum platform. MyNeighborAlice has a current supply of 100,000,000 with 67,913,333 in circulation. The last known price of MyNeighborAlice is 1.21552554 USD and is down -0.61 over the last 24 hours. It is currently trading on 191 active market(s) with $10,883,716.32 traded over the last 24 hours. More information can be found at https://www.myneighboralice.com/.
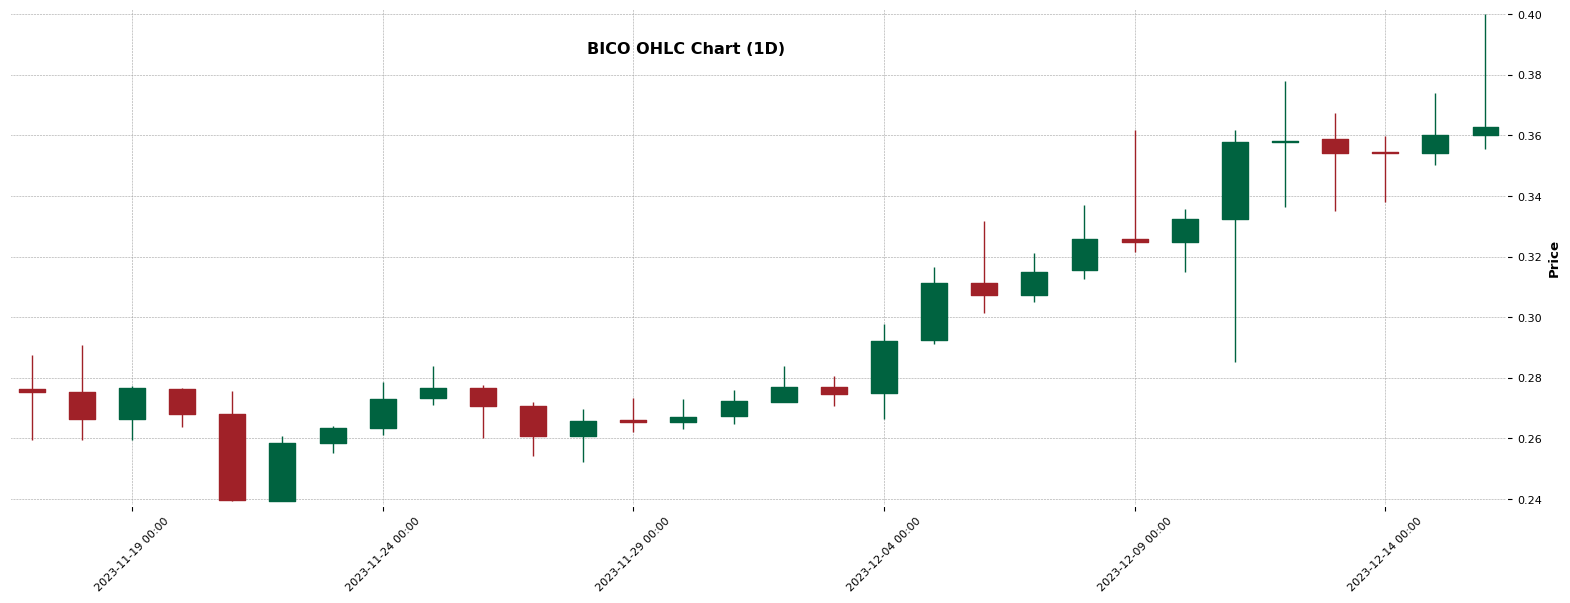
BICO – Head And Shoulders identified (1H)
Chart Pattern Information
The hourly chart of BICO indicates a potential “Head And Shoulders” pattern in formation, signaling a bullish outlook. This pattern began maturing around 12:00 on December 12, 2023 with a starting price of approximately 0.3687. It now appears to be culminating at 14:00 on December 13, 2023, with an estimated end price of around 0.3555. This predictive chart model is still incomplete. If it fully forms, we could anticipate possible profits up to about 0.3787. However, please bear in mind that the vertical stop loss for the pattern is set at 0.3322. This forecasted trend needs to be monitored closely.
About BICO
Biconomy (BICO) is a cryptocurrency launched in 2021and operates on the Ethereum platform. Biconomy has a current supply of 1,000,000,000 with 589,361,402.147202 in circulation. The last known price of Biconomy is 0.361 USD and is down -0.55 over the last 24 hours. It is currently trading on 99 active market(s) with $12,119,837.07 traded over the last 24 hours. More information can be found at https://biconomy.io.
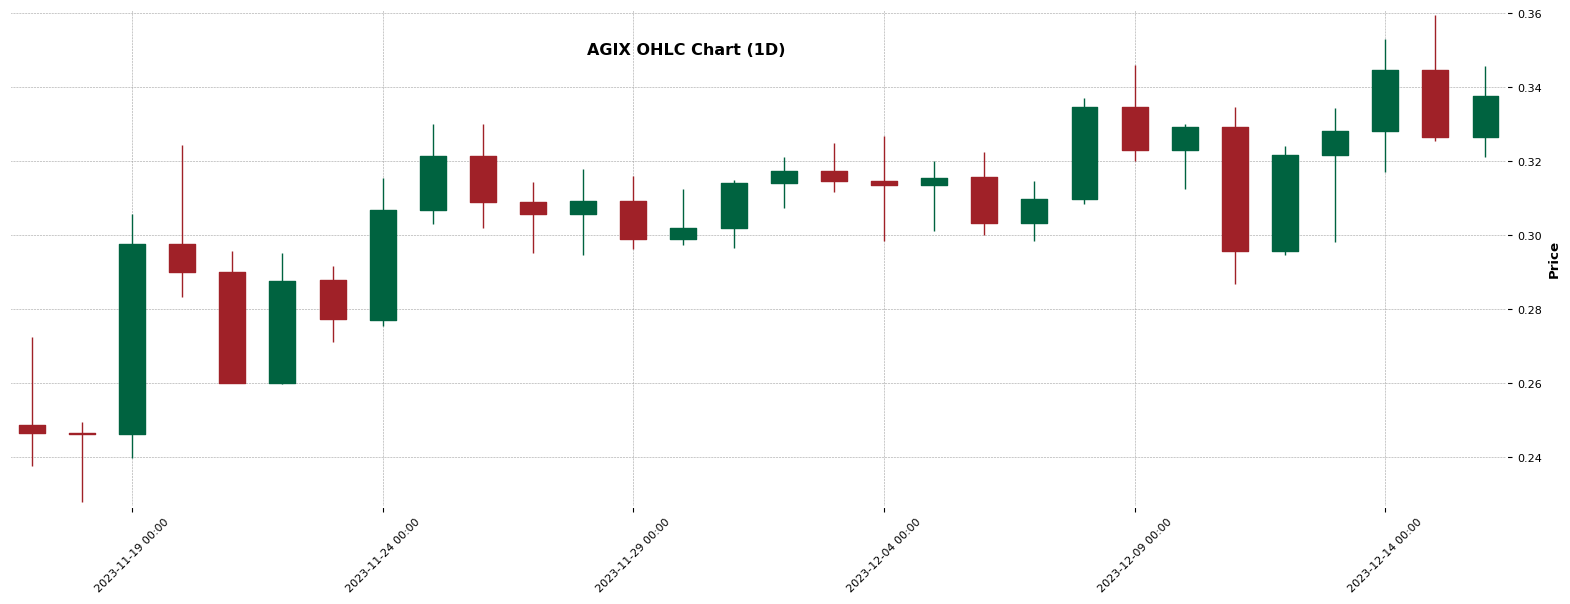
AGIX – Double Top identified (1H)
Chart Pattern Information
The AGIX hourly chart is currently forming a ‘Double Top’ pattern, a definitive bearish signal. It started on the 12th of December, 2023, at 00:00 with a price of 0.29663, peaked at 0.31537 on 09:00, and again rose to 0.32417 by 23:00 the same day. As of 14:00 the following day, the price is back to 0.29663. The pattern suggests a potential entry point at 0.2966 with a profit target of 0.2691 and a stop loss set at 0.3269. However, the pattern is still incomplete, requiring careful observation and risk management.
About AGIX
SingularityNET (AGIX) is a cryptocurrency and operates on the Ethereum platform. SingularityNET has a current supply of 1,364,517,977.3521397 with 1,249,801,993.6960192 in circulation. The last known price of SingularityNET is 0.337 USD and is down -2.01 over the last 24 hours. It is currently trading on 172 active market(s) with $52,566,636.33 traded over the last 24 hours. More information can be found at https://singularitynet.io/.
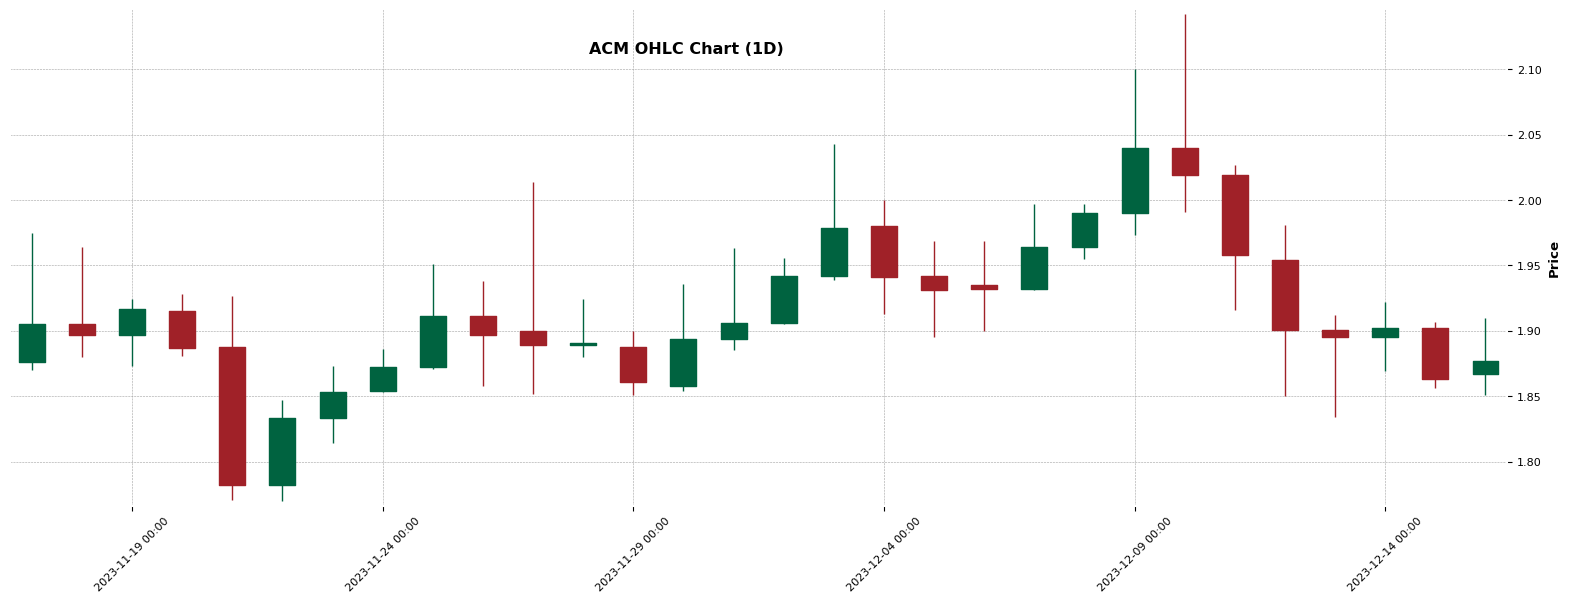
ACM – Triple Bottom identified (1H)
Chart Pattern Information
An anticipated bullish ‘Triple Bottom’ pattern is currently evolving on the ACM’s hourly chart. This pattern started forming on 2023-12-12 at 10:00:00, with a starting price of 1.9359. Price points at various times of 12th and 13th December defined its structure, with the low point at 1.834. As of 2023-12-13 at 13:00:00, the price stands at 1.8759, indicating the pattern is still maturing. The chart pattern signifies potential upside with first profit target at 1.9251. Though optimistic, investors should consider a stop loss at 1.8267 if the trend reverses. The pattern status remains ‘incomplete’ as of the latest update.
About ACM
AC Milan Fan Token (ACM) is a cryptocurrency and operates on the Chiliz platform. AC Milan Fan Token has a current supply of 20,000,000 with 6,027,911 in circulation. The last known price of AC Milan Fan Token is 1.87 USD and is down -0.48 over the last 24 hours. It is currently trading on 36 active market(s) with $992,053.38 traded over the last 24 hours. More information can be found at https://www.socios.com/.
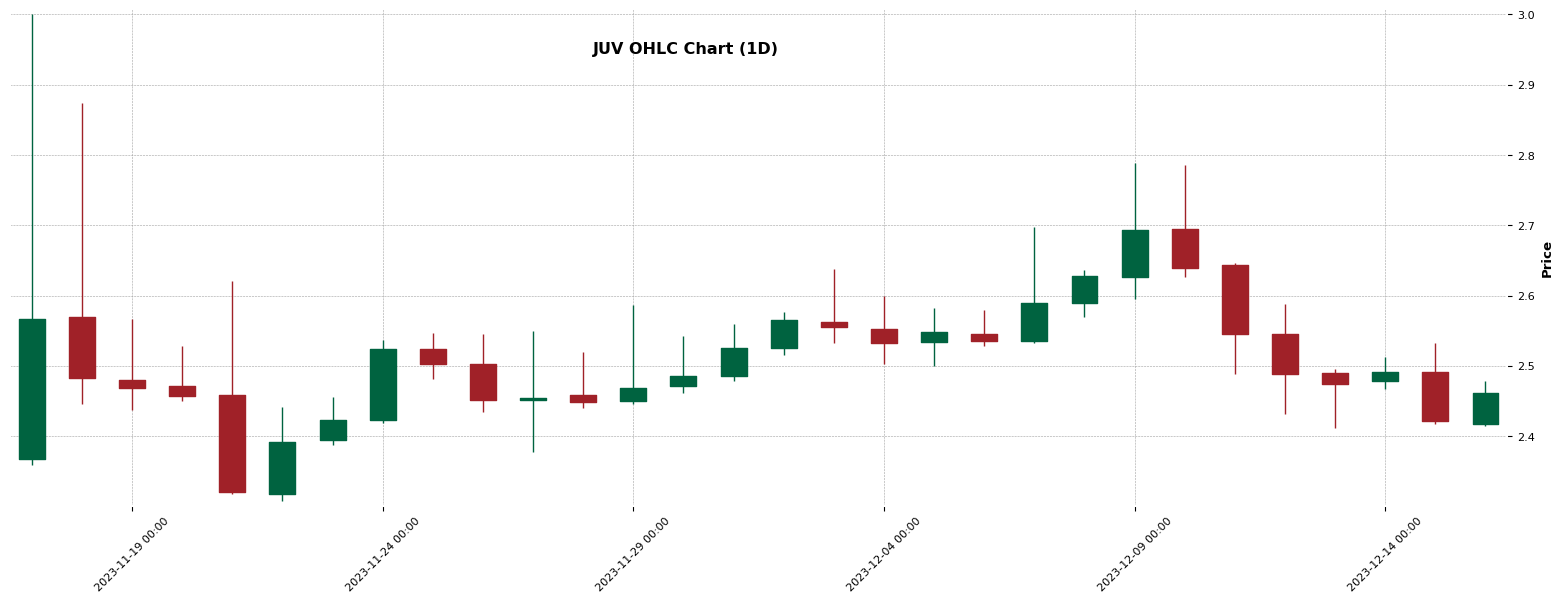
JUV – Double Bottom identified (1H)
Chart Pattern Information
The JUV stock chart is currently in the process of forming a bullish ‘Double Bottom’ pattern on its hourly chart. The pattern first marked at the price of $2.496 on 2023-12-12 13:00:00, briefly dipped to $2.432 at 17:00:00, then peaked again at the same price of $2.496 by 23:00:00. The chart showed a slight decline to $2.411 by 04:00:00 on 2023-12-13, and projected to climb back to $2.496 by 12:00:00. This pattern, however, is still incomplete with a potential profit future at $2.581 and a stop loss suggested at $2.4025. Please continue monitoring this dynamic situation.
About JUV
Juventus Fan Token (JUV) is a cryptocurrency launched in 2021and operates on the Chiliz platform. Juventus Fan Token has a current supply of 20,000,000 with 5,989,281 in circulation. The last known price of Juventus Fan Token is 2.463 USD and is down -1.22 over the last 24 hours. It is currently trading on 47 active market(s) with $2,248,833.83 traded over the last 24 hours. More information can be found at https://www.socios.com/juventus/.
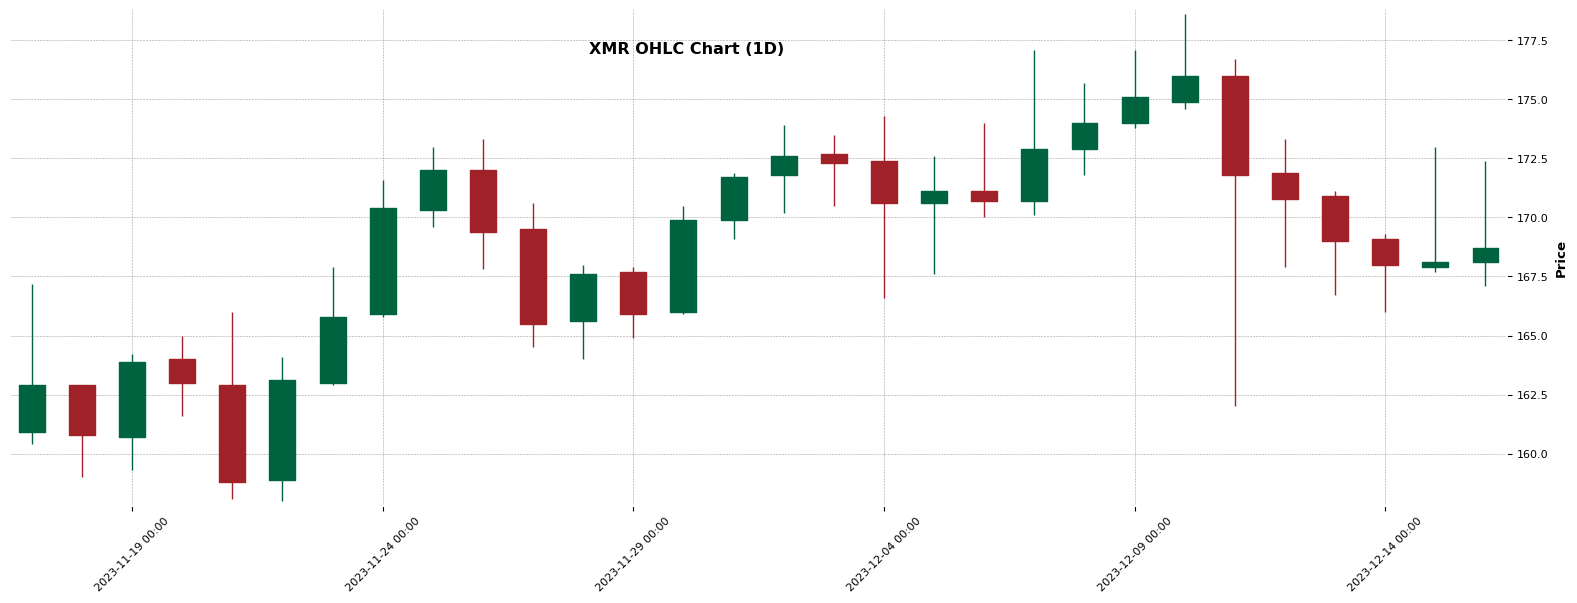
XMR – Triangle identified (1H)
Chart Pattern Information
A potential Triangle pattern is in the process of forming on the hourly chart of XMR. This started on 2023-12-11 at 12:00 when the price was at $174.2, then it dropped to $166.1 by 18:00 the same day. It rose again to $173.5 by 22:00 and the next touch point was at a lower figure of $166.7 on 2023-12-13 at 07:00. The pattern, however, remains incomplete. The intersect price at the projected completion date and time, 2023-12-15 at 10:00, is estimated to be approximately $167.54. Investors should monitor the chart for further development.
About XMR
Monero (XMR) is a cryptocurrency . Users are able to generate XMR through the process of mining. Monero has a current supply of 18,371,854.62338664. The last known price of Monero is 168.53 USD and is down -1.61 over the last 24 hours. It is currently trading on 258 active market(s) with $86,572,564.31 traded over the last 24 hours. More information can be found at https://www.getmonero.org/.
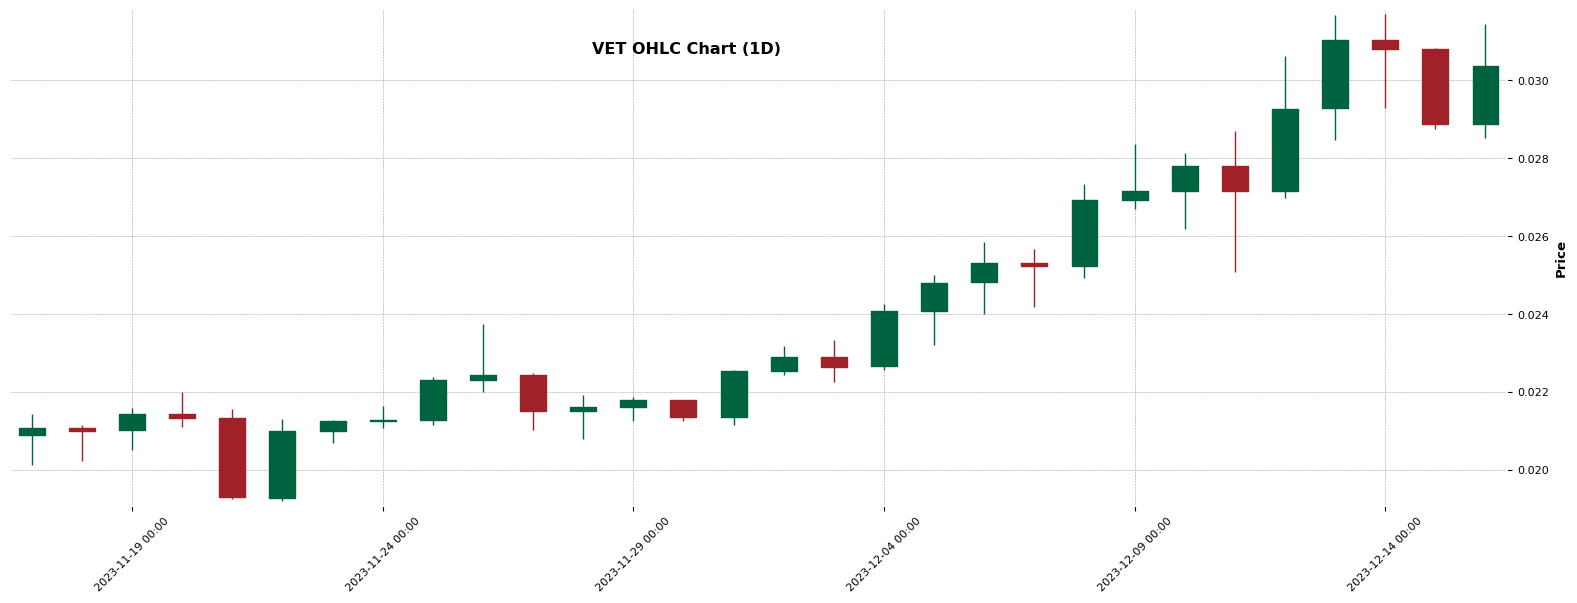
VET – Double Top identified (1H)
Chart Pattern Information
The VET hourly chart suggests a potential ‘Double Top’ chart pattern is taking shape. This bearish pattern commenced at 06:00 on the 12th of December, 2023, with a start price of $0.0284. The pattern experienced an upward swing to $0.03064 by 13:00, followed by a decline to $0.0284 by 21:00. On December 13th at midnight, a rebound to $0.031 was observed. However, the chart pattern remains incomplete. A complete execution entails the price dropping below the entry point of $0.0284 to signal a sell, with a stop-loss at $0.0313. Watch out for potential profits at $0.0258. This pattern indicates possible descending trends.
About VET
VeChain (VET) is a cryptocurrency . VeChain has a current supply of 85,985,041,177 with 72,714,516,834 in circulation. The last known price of VeChain is 0.0303 USD and is up 2.19 over the last 24 hours. It is currently trading on 258 active market(s) with $69,526,402.35 traded over the last 24 hours. More information can be found at https://www.vechain.org/.
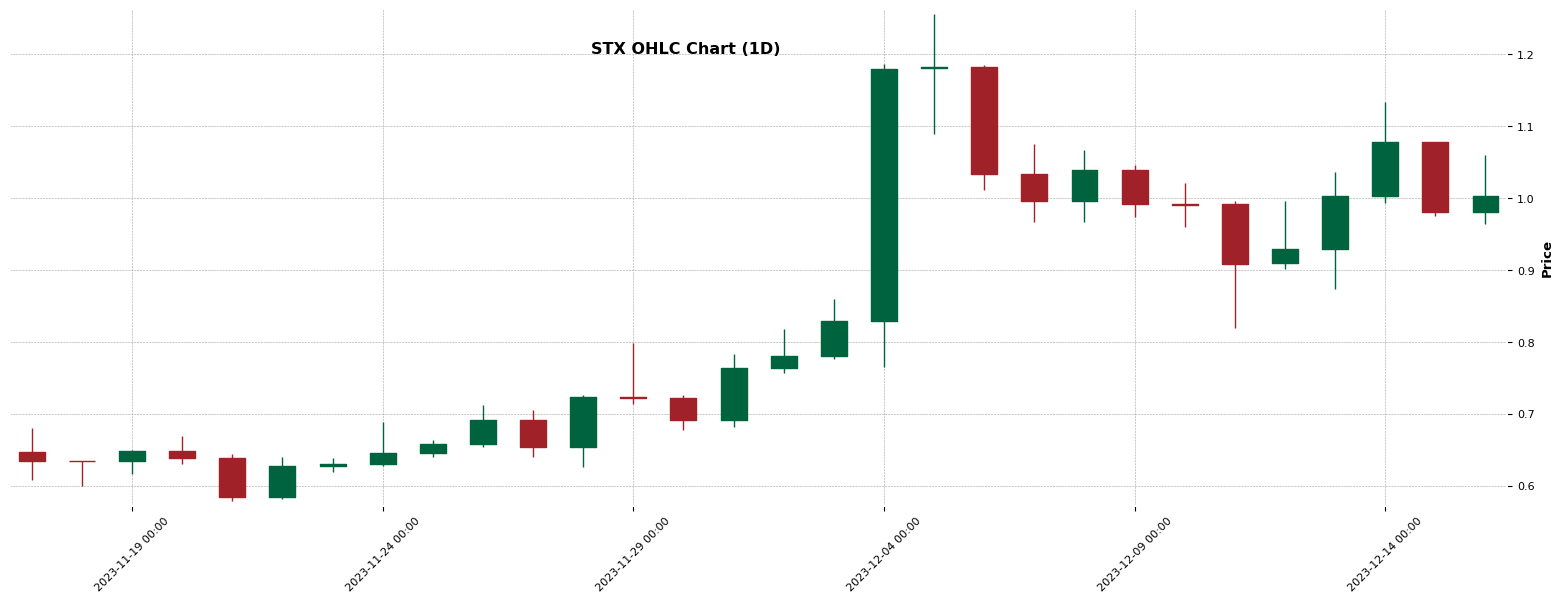
STX – Triangle identified (1H)
Chart Pattern Information
The STX hourly chart is currently forming what appears to be a Triangle pattern, indicating potential future market movements. As of now, the pattern is incomplete, with its first notable point at a price of 1.0032 on December 10, 2023 at 21:00, followed by a dip to 0.82 on December 11. Prices picked up again to 0.996 on December 12 but dropped down to 0.8741 the following day. The intersection point is expected to occur at a price of around 0.9716 on December 17, 2023 at 05:00. As the pattern evolves, it would be prudent to keep an eye for updates.
About STX
Stacks (STX) is a cryptocurrency . Users are able to generate STX through the process of mining. Stacks has a current supply of 1,818,000,000 with 1,428,123,041.169721 in circulation. The last known price of Stacks is 1.003 USD and is up 0.50 over the last 24 hours. It is currently trading on 133 active market(s) with $119,613,888.50 traded over the last 24 hours. More information can be found at https://stacks.co.
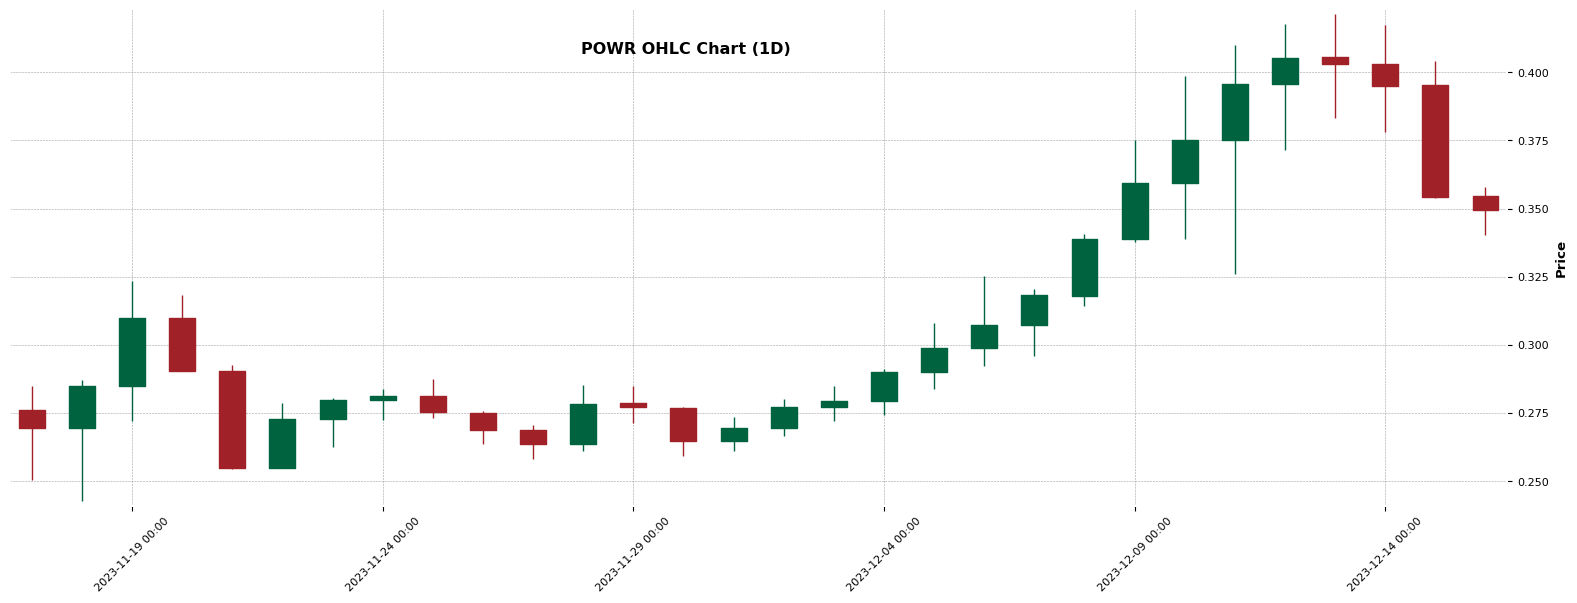
POWR – Double Top identified (1H)
Chart Pattern Information
POWR is currently demonstrating a potential ‘Double Top’ pattern on its hourly chart, bearish in nature. The pattern began forming on 2023-12-12 at 18:00 with a start price of 0.3922, reaching a peak (Point A) at 0.4172 by midnight. It retraced to 0.3922 by 01:00 (Point B), before rising to 0.4148 at 08:00 (Point C). By 10:00, it returned to its entry price of 0.3922. As this pattern is still incomplete, diligent monitoring for its potential maturity is advised. A future stop-loss point is predicted at 0.4197, with a potential profit target at 0.3672.
About POWR
Powerledger (POWR) is a cryptocurrency launched in 2017and operates on the Ethereum platform. Powerledger has a current supply of 999,506,122.99937 with 511,654,603.083985 in circulation. The last known price of Powerledger is 0.34 USD and is down -5.15 over the last 24 hours. It is currently trading on 104 active market(s) with $11,317,419.16 traded over the last 24 hours. More information can be found at https://powerledger.io/.
For more chart patterns, trading signals, and crypto data, download our app in the Appstore or Playstore: Download Now