Welcome to today’s edition of Crypto Chart Pattern Alerts. This time, we looked at the hourly chart and found some promising patterns for tokens, such as STX, VET, or AGIX. Let’s dive right into it!
For more chart patterns, trading signals, and crypto data, download our app in the Appstore or Playstore: Download Now
POWR – Double Bottom identified (1H)
Chart Pattern Information
The hourly chart for POWR is in the process of forming a bullish ‘Double Bottom’ pattern as of December 18, 2023. Starting at 00:00:00 with a price of 0.37, it dropped to 0.342 by 02:00:00, escalating again to 0.37 by 09:00:00. A minor decrease was noted at 10:00:00 to 0.3442, initiating formation of the second bottom. Please note this pattern is still incomplete. An entry is projected at a 0.37 price point, with a potential profit1 target of 0.398, and a stop loss suggested at 0.3392. Exact completion of pattern remains even at 0.37 by 18:00:00.
About POWR
Powerledger (POWR) is a cryptocurrency launched in 2017and operates on the Ethereum platform. Powerledger has a current supply of 999,506,122.99937 with 510,974,130.521818 in circulation. The last known price of Powerledger is 0.369 USD and is down -0.70 over the last 24 hours. It is currently trading on 104 active market(s) with $32,510,115.89 traded over the last 24 hours. More information can be found at https://powerledger.io/.

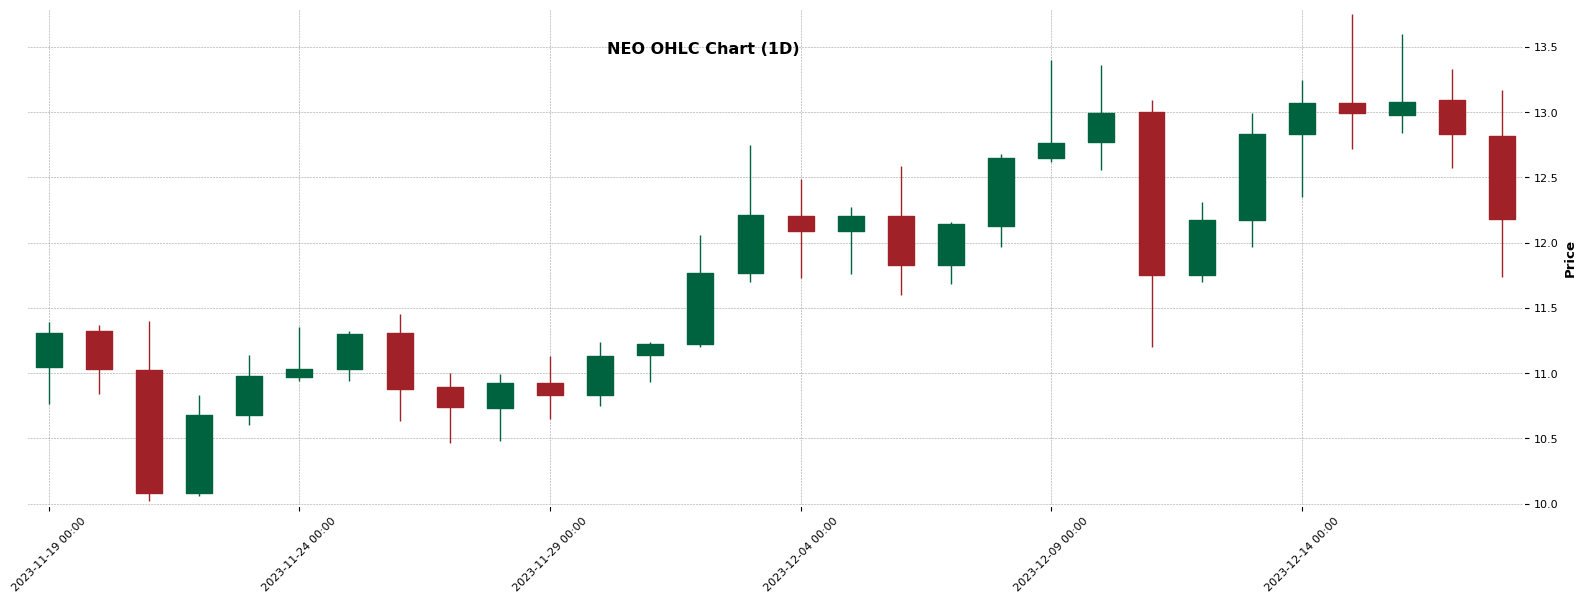
NEO – Double Bottom identified (1H)
Chart Pattern Information
A potential bullish ‘Double Bottom’ pattern appears to be emerging on the NEO hourly chart for December 18, 2023. It commenced at 09:00 with a start price of 12.25. The first drop (‘A’) occurred at 10:00, hitting a price of 11.74. Subsequently, it rebounded to 12.25 at 14:00 (‘B’) and then dipped to 11.95 at 16:00 (‘C’). The pattern suggests an entry point at 12.25, with a possible gain to 12.76 (Profit1), while the stoploss is set at 11.689. It’s important to note that this chart formation is currently in progress and not yet fully formed or completed.
About NEO
Neo (NEO) is a cryptocurrency . Neo has a current supply of 100,000,000 with 70,538,831 in circulation. The last known price of Neo is 12.16 USD and is down -6.59 over the last 24 hours. It is currently trading on 302 active market(s) with $85,242,969.69 traded over the last 24 hours. More information can be found at https://neo.org/.
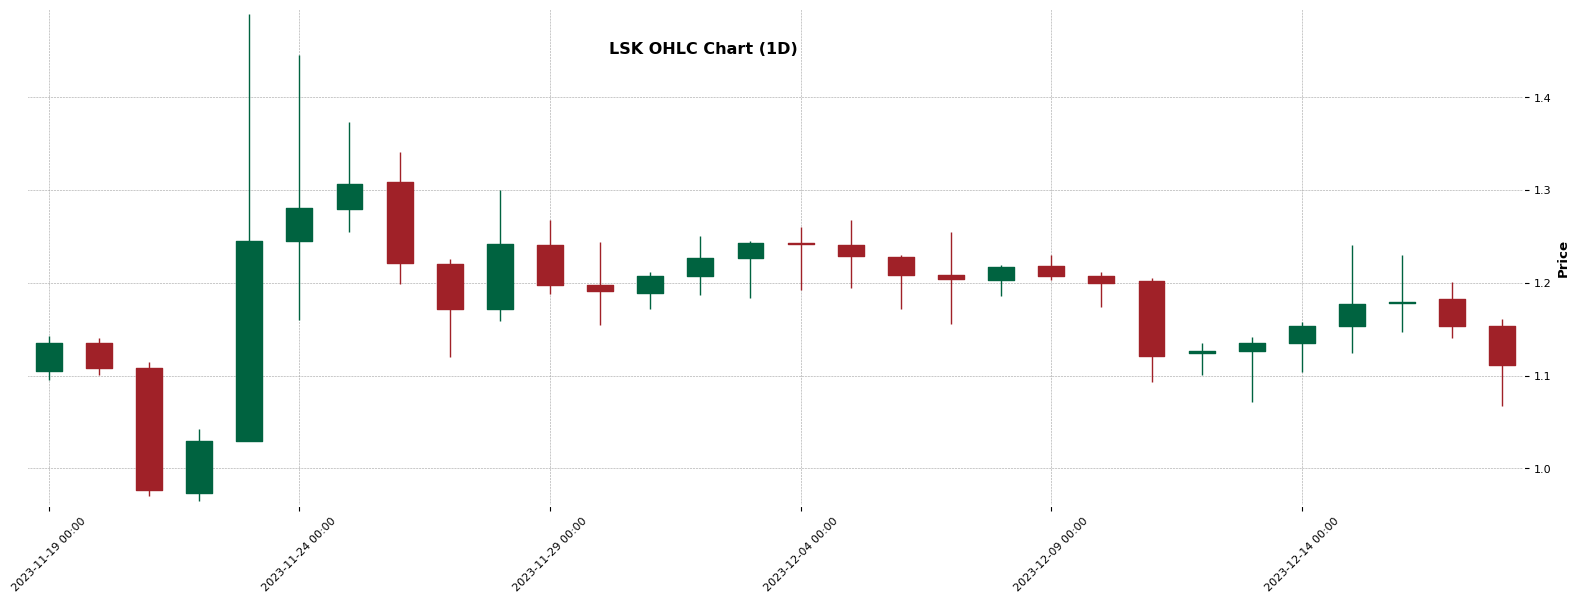
LSK – Triple Bottom identified (1H)
Chart Pattern Information
A potentially bullish ‘Triple Bottom’ pattern appears to be currently forming on the hourly chart for LSK. As per the latest data, the pattern began moulding on December 17, 2023, at 04:00 with a starting price of 1.2198. Since then, LSK experienced periodic fluctuations, hitting a low of 1.067 at 10:00 on Dec 18. However, the pattern remains incomplete with the last recorded end price at 1.149 on December 18, at 10:00. If matured, it may suggest a possible upward trend, but as of now, it needs careful monitoring considering the set stop loss at 1.0536.
About LSK
Lisk (LSK) is a cryptocurrency launched in 2016. Lisk has a current supply of 144,818,773 with 128,900,444.52198455 in circulation. The last known price of Lisk is 1.109 USD and is down -5.85 over the last 24 hours. It is currently trading on 77 active market(s) with $3,621,344.47 traded over the last 24 hours. More information can be found at https://Lisk.com/.
BLZ – Double Top identified (1H)
Chart Pattern Information
The BLZ hourly chart is currently exhibiting the tentative formation of a ‘Double Top’ pattern. This bearish chart pattern started forming on 2023-12-17 at 10:00:00 with a price of 0.327 and hit a peak of 0.3724 at 17:00:00. It showed a return to the initial price level at 0.327 by 02:00:00 on 2023-12-18, before peaking again at 0.3744 by 14:00:00. The pattern, though still incomplete, is anticipated to mature if the end price drops back to 0.327 by 16:00:00 on 2023-12-18. Expected profits lie at 0.2796, with a stop loss placed at 0.3791.
About BLZ
Bluzelle (BLZ) is a cryptocurrency and operates on the Ethereum platform. Bluzelle has a current supply of 500,000,000 with 426,454,176.7280512 in circulation. The last known price of Bluzelle is 0.355 USD and is down -0.53 over the last 24 hours. It is currently trading on 112 active market(s) with $60,613,605.75 traded over the last 24 hours. More information can be found at https://bluzelle.com/.

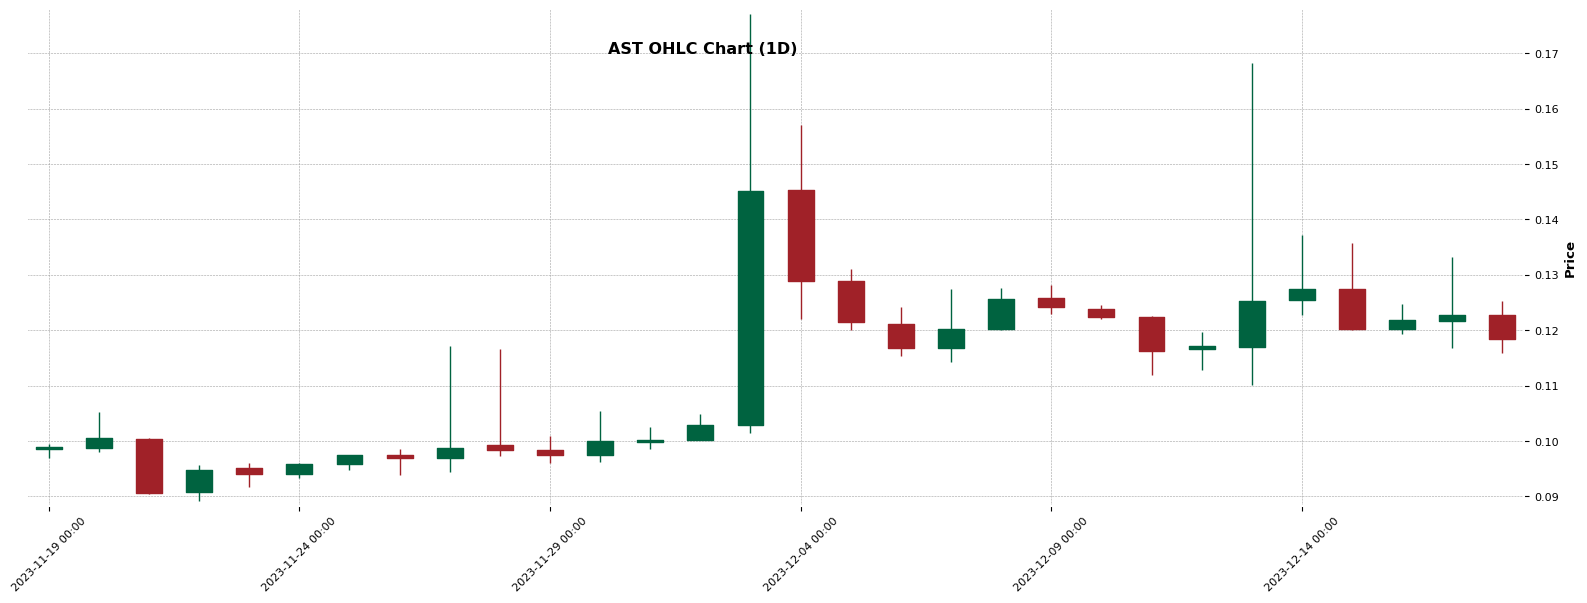
AST – Double Bottom identified (1H)
Chart Pattern Information
A potential “Double Bottom” pattern, indicative of a bullish trend, appears to be currently forming on the hourly chart of AST. The pattern started on ‘2023-12-18 00:00:00′ (start price $0.125). Price dip at ’06:00:00′ ($0.1172) and ’10:00:00′ ($0.1159) forms the double bottom. Should the pattern mature, given its entry price at $0.125 with a profit target of $0.1341 and a set stop loss at $0.115, this could represent a potentially profitable opportunity. However, please note that the pattern remains incomplete as of end time ’16:00:00’ with a closing price of $0.125.
About AST
AirSwap (AST) is a cryptocurrency and operates on the Ethereum platform. AirSwap has a current supply of 500,000,000 with 174,479,533.46 in circulation. The last known price of AirSwap is 0.119 USD and is down -4.03 over the last 24 hours. It is currently trading on 39 active market(s) with $2,553,895.03 traded over the last 24 hours. More information can be found at https://www.airswap.io/.
OXT – Head And Shoulders identified (1H)
Chart Pattern Information
The OXT hourly chart is currently hinting towards a forming ‘Head and Shoulders’ pattern, typically a bearish indicator. This pattern started evolving around ‘2023-12-16 19:00:00’ with a start price of roughly 0.0805. The pattern reached its peak at ‘2023-12-17 18:00:00’ with the ‘head’ forming at a high of 0.0904, and is projected to complete by ‘2023-12-18 08:00:00’. The suggested entry point is around 0.0819. However, it’s worth noting that this pattern is still in the process of forming and remains incomplete, which underscores the inherent uncertainties in financial forecasting.
About OXT
Orchid (OXT) is a cryptocurrency and operates on the Ethereum platform. Orchid has a current supply of 1,000,000,000 with 979,379,107.8279902 in circulation. The last known price of Orchid is 0.093 USD and is up 6.62 over the last 24 hours. It is currently trading on 120 active market(s) with $25,697,936.22 traded over the last 24 hours. More information can be found at https://www.orchid.com/.

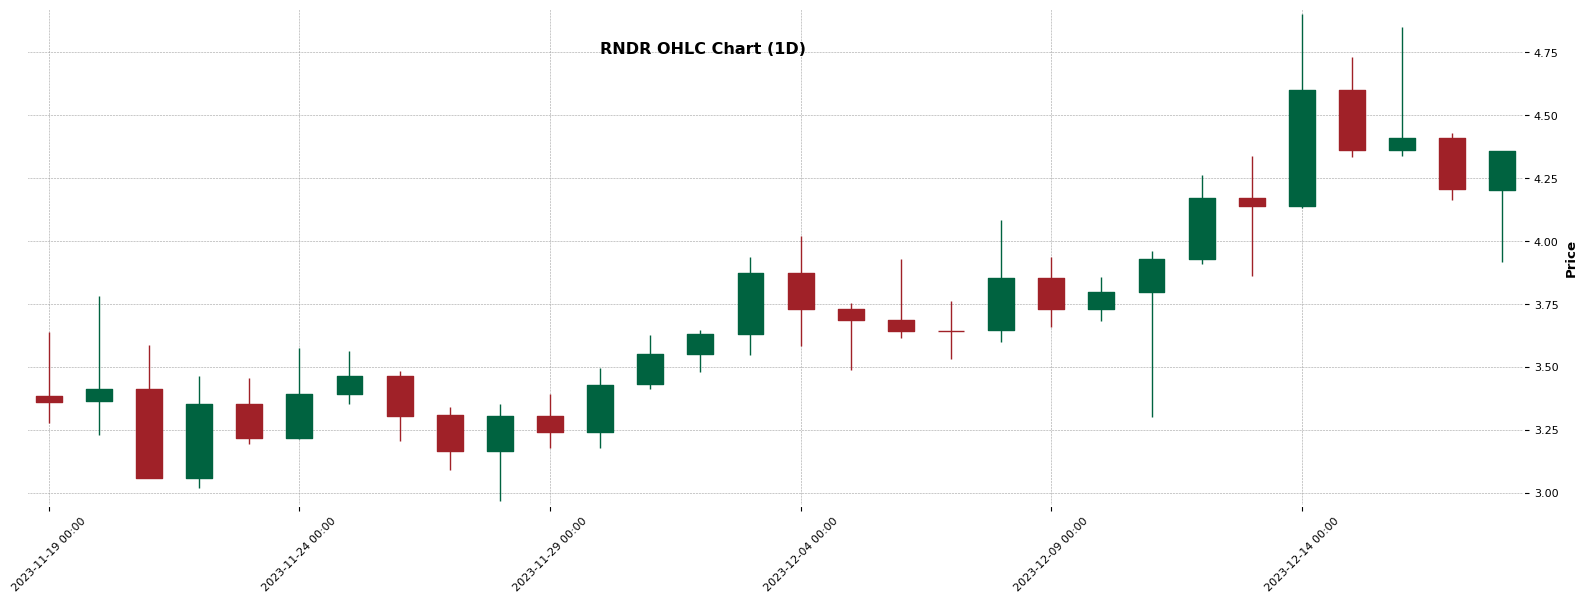
RNDR – Double Bottom identified (1H)
Chart Pattern Information
Analyzing RNDR’s data, a potential ‘Double Bottom’ pattern, indicative of a bullish market trend, is currently forming on its hourly chart. The pattern began developing on 2023-12-17 at 01:00:00 with a starting price of 4.418, hitting its lowest point at 4.084 on 2023-12-18 at 04:00:00. The pattern suggests a prospective profit entry point at 4.752, with a stop loss suggestion at 4.0506 to mitigate risk. However, this pattern is still in progress and incomplete, with its maturity status remaining at zero. Therefore, investors are advised to watch the market closely to capitalize when it fully forms.
About RNDR
Render (RNDR) is a cryptocurrency launched in 2019and operates on the Ethereum platform. Render has a current supply of 530,962,614.97878325 with 371,908,453.10879594 in circulation. The last known price of Render is 4.33 USD and is down -0.41 over the last 24 hours. It is currently trading on 256 active market(s) with $124,123,338.77 traded over the last 24 hours. More information can be found at https://rendernetwork.com/.
ILV – Double Bottom identified (1H)
Chart Pattern Information
A potential ‘Double Bottom’ bullish pattern is currently forming on the hourly chart of ILV. The pattern started at 93.33 on December 17, 2023 at 2:00 AM, fell to a low of 86.58 on the same day, and then rose back to 93.33 by 5:00 PM on December 18, 2023. However, the pattern is not yet complete, as per data available till the latest recorded time-slot. If the trend continues, the possible entry point could be at 93.33 with a potential profit of 100.08, and a stop-loss at around 85.905. Kindly monitor the market closely to accurately benefit from this likely trend.
About ILV
Illuvium (ILV) is a cryptocurrency and operates on the Ethereum platform. Illuvium has a current supply of 7,889,583.35698762 with 3,767,377.29675883 in circulation. The last known price of Illuvium is 88.42 USD and is down -3.61 over the last 24 hours. It is currently trading on 141 active market(s) with $28,643,962.01 traded over the last 24 hours. More information can be found at https://illuvium.io/.

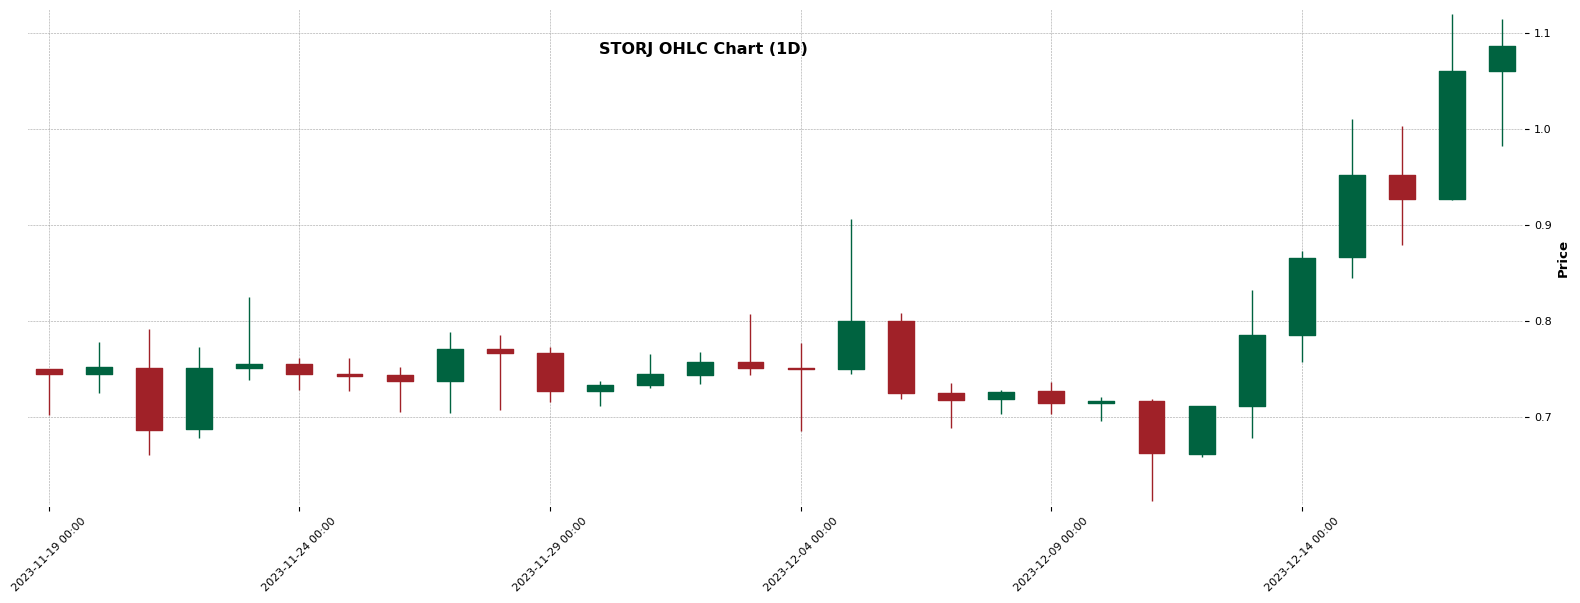
STORJ – Double Top identified (1H)
Chart Pattern Information
The STORJ hourly chart is currently in the process of forming a Double Top pattern, which could potentially signal a bearish trend. The pattern started at 1.0325 on 2023-12-17 06:00:00 and reached a peak at 1.1191 on 2023-12-17 18:00:00, before falling back to 1.0325 on 2023-12-18 03:00:00. This evolution indicates a precise potential entry point at 1.0325, with a target profit of 0.9459 and a stop loss at 1.12776 to minimize the risk. However, it’s crucial to note that this pattern is still incomplete at this stage.
About STORJ
Storj (STORJ) is a cryptocurrency and operates on the Ethereum platform. Storj has a current supply of 424,999,998.00000113 with 393,095,938.6729615 in circulation. The last known price of Storj is 1.082 USD and is down -1.90 over the last 24 hours. It is currently trading on 194 active market(s) with $186,755,214.64 traded over the last 24 hours. More information can be found at https://storj.io/.
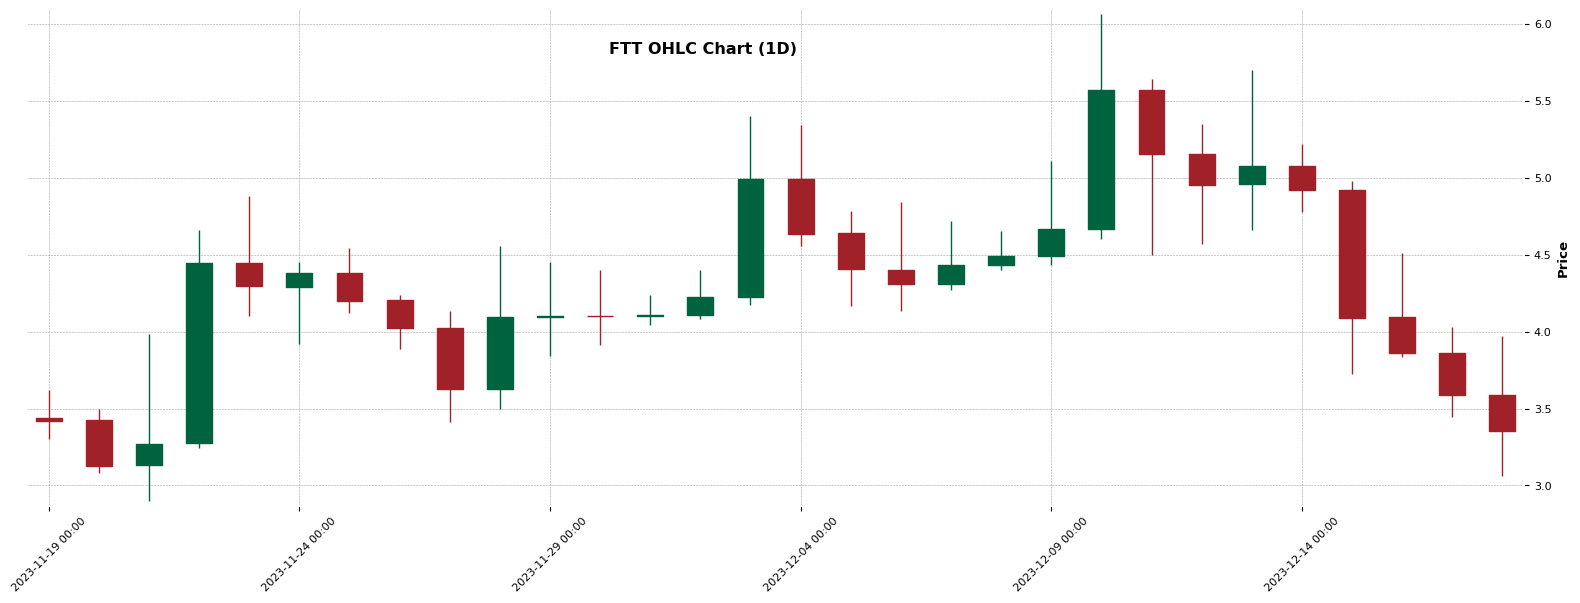
FTT – Double Bottom identified (1H)
Chart Pattern Information
A potential bullish ‘Double Bottom’ pattern is currently forming on the hourly chart of FTT. The early pattern started to shape on 2023-12-16 at 20:00:00 with a starting price of 4.03. It then moved to reach an initial bottom of 3.515 on 2023-12-17 at 04:00:00, before rebounding back towards 4.03 by 08:00:00. The chart signaled a second dip at 13:00:00 with a price of 3.4453. As of 01:00:00 on 2023-12-18, the price returned again to 4.03, solidifying the pattern formation. However, it is essential to note that this pattern is yet to complete.
About FTT
FTX Token (FTT) is a cryptocurrency launched in 2019and operates on the BNB Beacon Chain (BEP2) platform. FTX Token has a current supply of 328,895,103.813207. The last known price of FTX Token is 3.36 USD and is down -9.93 over the last 24 hours. It is currently trading on 200 active market(s) with $101,349,357.85 traded over the last 24 hours.
For more chart patterns, trading signals, and crypto data, download our app in the Appstore or Playstore: Download Now