Welcome to today’s edition of Crypto Chart Pattern Alerts. This time, we looked at the hourly chart and found some promising patterns for tokens, such as STX, VET, or AGIX. Let’s dive right into it!
For more chart patterns, trading signals, and crypto data, download our app in the Appstore or Playstore: Download Now
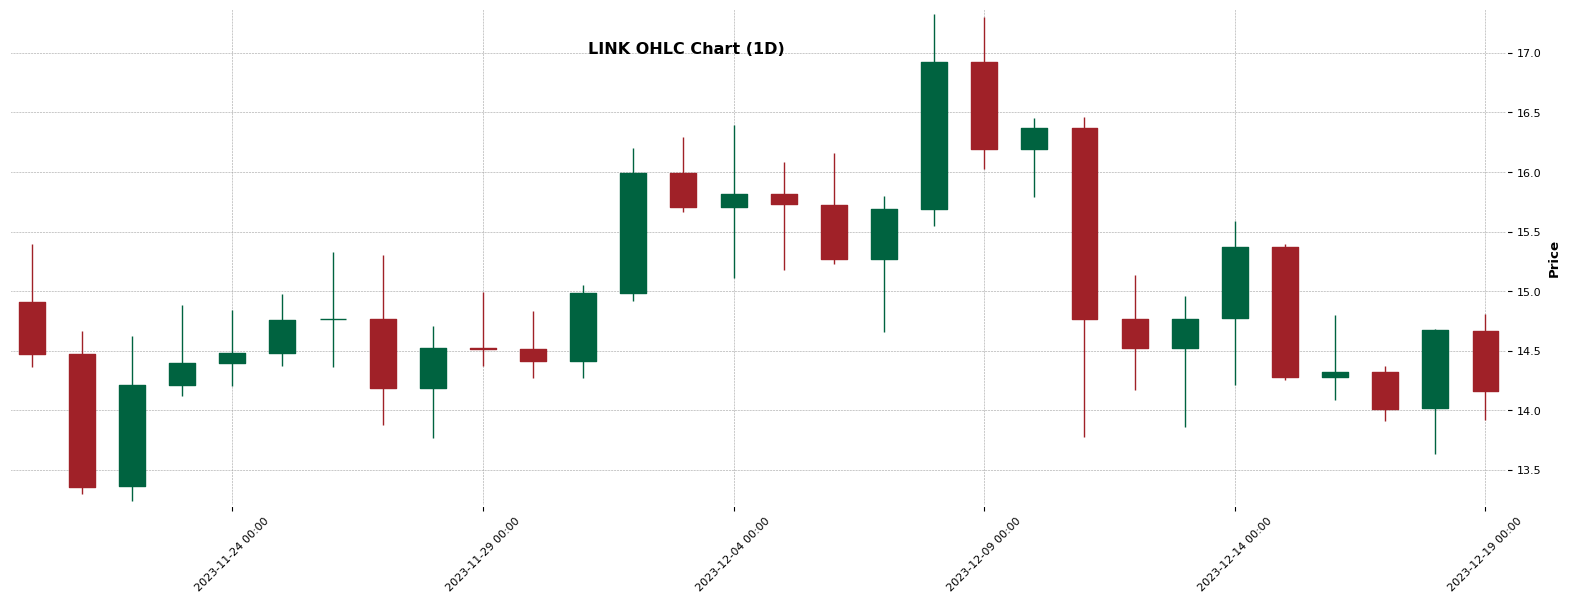
LINK – Double Top identified (1H)
Chart Pattern Information
The current data suggests that a ‘Double Top’ pattern, a bearish indicator, is potentially forming on the hourly chart for LINK. As of 11am on 18th December 2023, the asset price was at $14.43, dipping to $13.86 by 16:00, and rising again to $14.808 at 2am the next day. The pattern reverts back to $13.86 by 17:00, confirming the ‘Double Top’. However, keep an eye out as this pattern is still incomplete and could evolve over time. Presently, the suggested entry price is $13.86 with a stop loss at $14.9028. Potential profit1 stands at $12.912. Monitoring is advised until pattern maturity.
About LINK
Chainlink (LINK) is a cryptocurrency and operates on the Ethereum platform. Chainlink has a current supply of 1,000,000,000 with 568,099,970.4527867 in circulation. The last known price of Chainlink is 14.139 USD and is down -1.31 over the last 24 hours. It is currently trading on 1517 active market(s) with $452,136,367.27 traded over the last 24 hours. More information can be found at https://chain.link/.

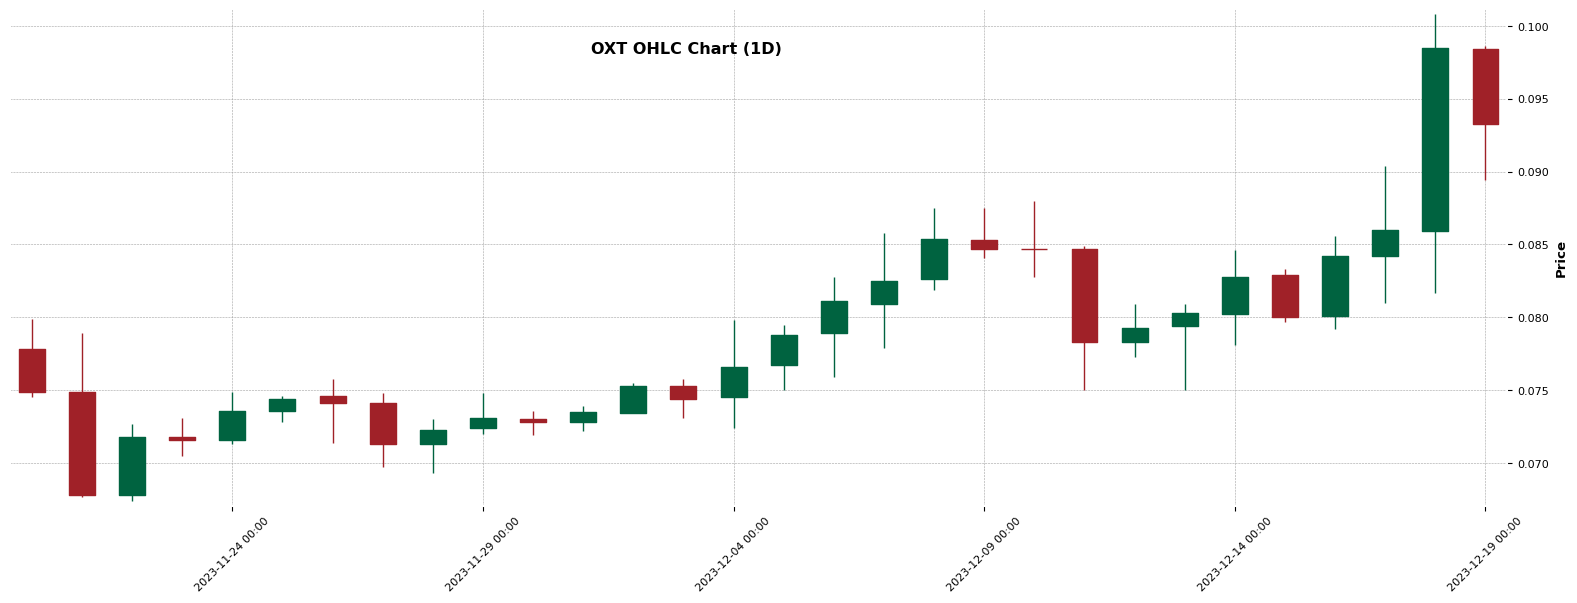
OXT – Triple Top identified (1H)
Chart Pattern Information
In the hourly chart of OXT, a ‘Triple Top’ pattern is forming, observed between the timestamps ‘2023-12-17 13:00:00’ and ‘2023-12-18 15:00:00’. ‘Triple Top’ is a bearish pattern that may indicate a potential market trend reversal. The initial price at the onset of the pattern is 0.0799, and the end price is projected to be 0.0835. Please note, this pattern is currently incomplete and the suggested entry point is 0.0835 with a stop loss at 0.1027. The level one profit target is 0.0643. This analysis is continuously updated as the chart pattern matures.
About OXT
Orchid (OXT) is a cryptocurrency and operates on the Ethereum platform. Orchid has a current supply of 1,000,000,000 with 979,379,107.8279902 in circulation. The last known price of Orchid is 0.09340781 USD and is down -0.04 over the last 24 hours. It is currently trading on 121 active market(s) with $22,218,173.01 traded over the last 24 hours. More information can be found at https://www.orchid.com/.

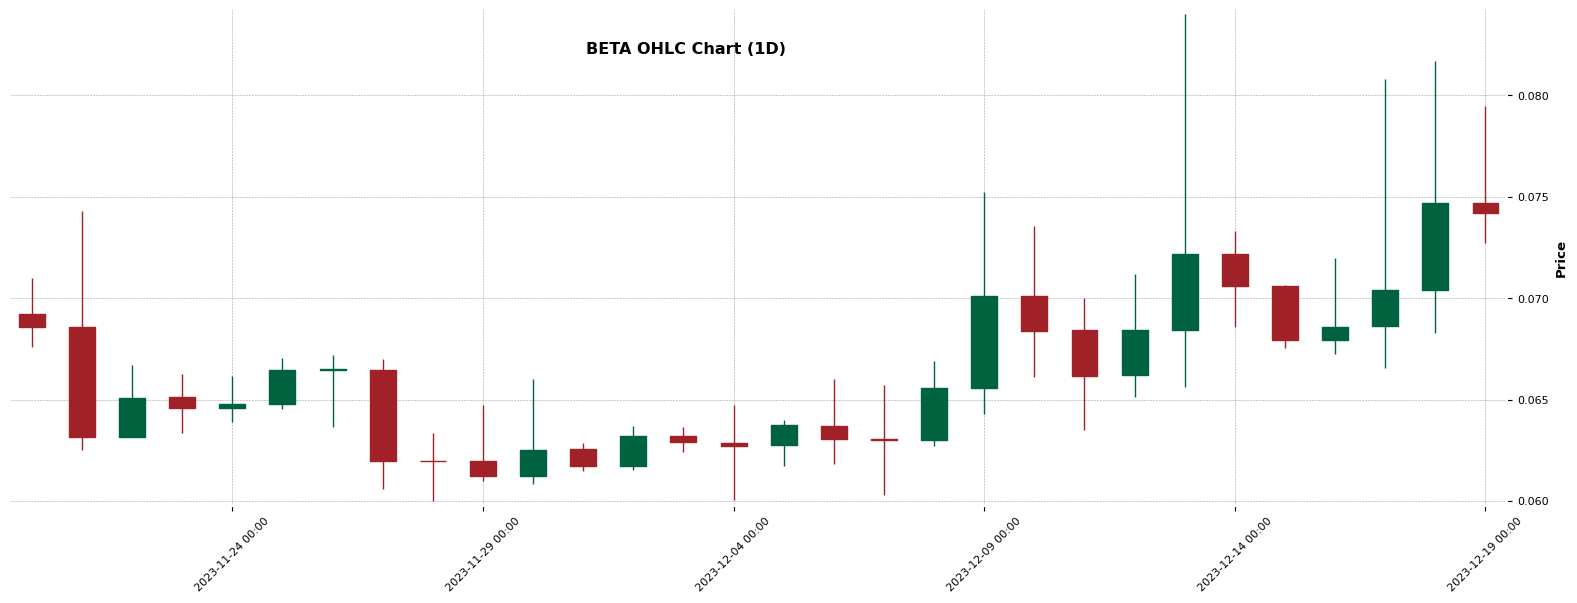
BETA – Double Top identified (1H)
Chart Pattern Information
The BETA hourly chart is displaying a potential bearish pattern— ‘Double Top.’ The pattern began forming on 2023-12-18 at 17:00:00, with a start price of 0.074. It hit a peak (‘a price’) of 0.0817 by 18:00:00 before dropping to ‘b price’ of 0.074 at 00:00:00 on December 19. The ‘c price’ notes a moderate rise to 0.0795 at 07:00:00, reconfirming the pattern. By 12:00:00, the price is back at 0.074. As of now, the pattern is labeled as ‘incomplete,’ but if it completes, the profit could be 0.0663. Stop loss is suggested at 0.08247.
About BETA
Beta Finance (BETA) is a cryptocurrency launched in 2021and operates on the Ethereum platform. Beta Finance has a current supply of 1,000,000,000 with 737,878,788 in circulation. The last known price of Beta Finance is 0.074 USD and is down -2.84 over the last 24 hours. It is currently trading on 74 active market(s) with $5,294,307.24 traded over the last 24 hours. More information can be found at https://betafinance.org/.

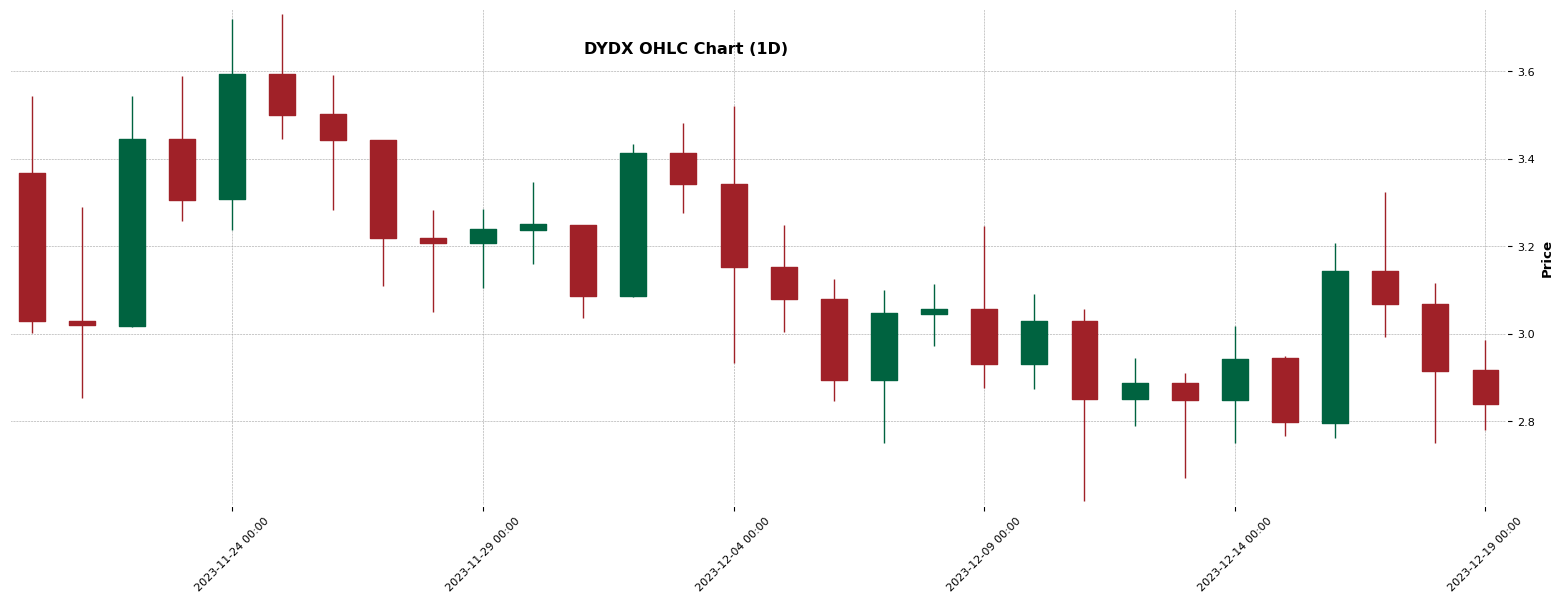
DYDX – Triangle identified (1H)
Chart Pattern Information
The DYDX currently exhibits a potential Triangle chart pattern on its hourly chart. On December 18, 2023, the price ranged from 3.029 at 04:00 to 2.751 at 10:00. It then increased to 2.985 on December 19, 2023, at 02:00 and later decreased to 2.855 at 09:00. This pattern is currently in the process of forming, with an expected intersection price of 2.9354266666666664 on December 20, 2023, at 01:00. Though its status remains incomplete, its maturity level is established. Further progression depends on multiple factors, and no profits are currently forecasted.
About DYDX
dYdX (Native) (DYDX) is a cryptocurrency launched in 2021and operates on the Osmosis platform. dYdX (Native) has a current supply of 1,000,000,000 with 0 in circulation. The last known price of dYdX (Native) is 2.832 USD and is down -1.76 over the last 24 hours. It is currently trading on 92 active market(s) with $457,136.16 traded over the last 24 hours. More information can be found at https://dydx.trade/.

OXT – Triple Top identified (1H)
Chart Pattern Information
A potential ‘Triple Top’ bearish chart pattern is currently in the process of forming on the OXT hourly chart. This pattern, which began on December 17, 2023, at a starting price of $0.0799, has shown significant price movements at key times with an entry point of $0.0835. Being a bearish pattern, it intimates a possible downward shift in prices. While it’s still incomplete, traders would expect a profit of $0.0643 if the pattern matures fully. The designated stop loss is set at $0.1027 as a safeguard against considerable losses. Investors should monitor this trend closely.
About OXT
Orchid (OXT) is a cryptocurrency and operates on the Ethereum platform. Orchid has a current supply of 1,000,000,000 with 979,379,107.8279902 in circulation. The last known price of Orchid is 0.0934 USD and is down -0.04 over the last 24 hours. It is currently trading on 121 active market(s) with $22,218,173.01 traded over the last 24 hours. More information can be found at https://www.orchid.com/.

For more chart patterns, trading signals, and crypto data, download our app in the Appstore or Playstore: Download Now