Welcome to today’s edition of Crypto Chart Pattern Alerts. This time, we looked at the hourly chart and found some promising patterns for tokens, such as ETH, EGLD, and BCH. Let’s dive right into it!
For more chart patterns, trading signals, and crypto data, download our app in the Appstore or Playstore: Download Now
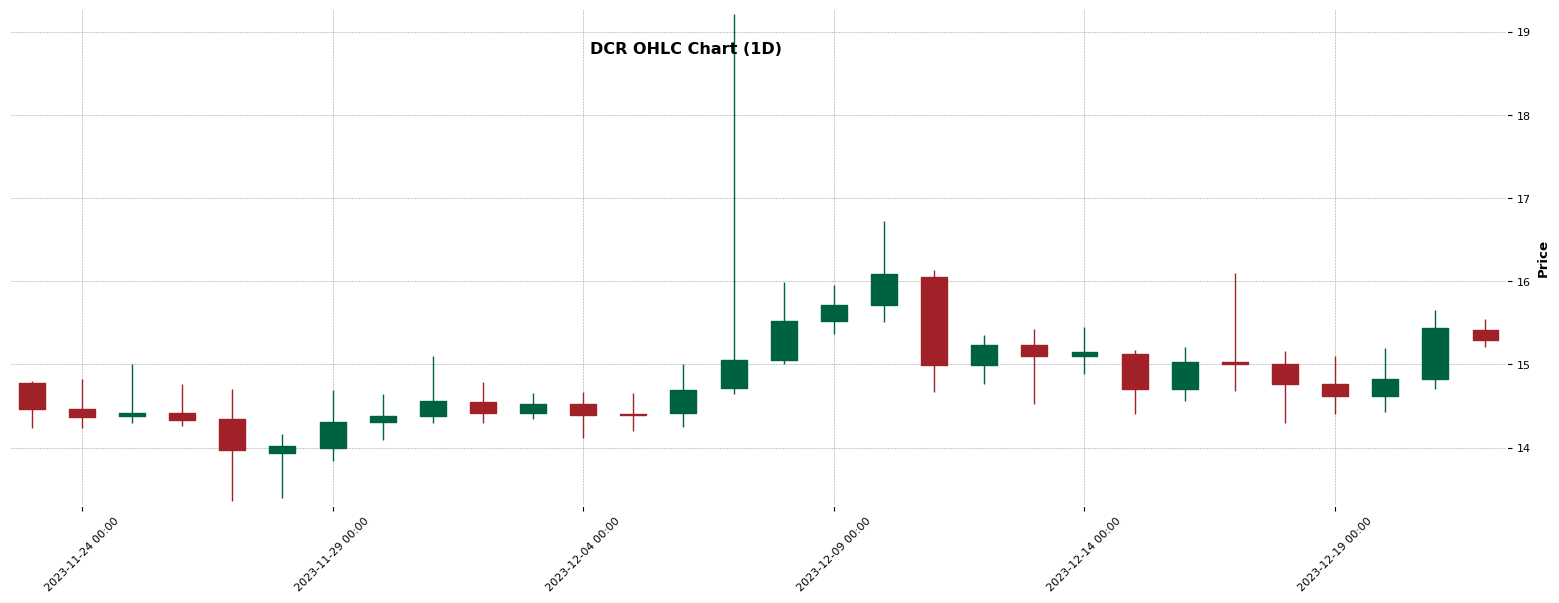
DCR – Double Top identified (1H)
Chart Pattern Information
The Double Top pattern, a bearish indicator, is currently forming on the DCR’s hourly chart. From a starting point on 2023-12-21 at 10:00, the price peaked at $15.66 at 11:00 before retreating to $15.08 by 16:00. A second peak was reached at $15.55 on 2023-12-22 at 01:00 with the end price of $15.08 at 09:00. This pattern suggests the potential for future downward trend. However, note that it remains incomplete. The pattern points toward a possible profit of $14.5, but it also suggests a stop loss at $15.718 as a safe measure. Keep observing the pattern before making investment decisions.
About DCR
Decred (DCR) is a cryptocurrency launched in 2016. Users are able to generate DCR through the process of mining. Decred has a current supply of 15,727,723.48756375. The last known price of Decred is 15.30 USD and is up 1.17 over the last 24 hours. It is currently trading on 72 active market(s) with $2,483,429.66 traded over the last 24 hours. More information can be found at https://decred.org/.
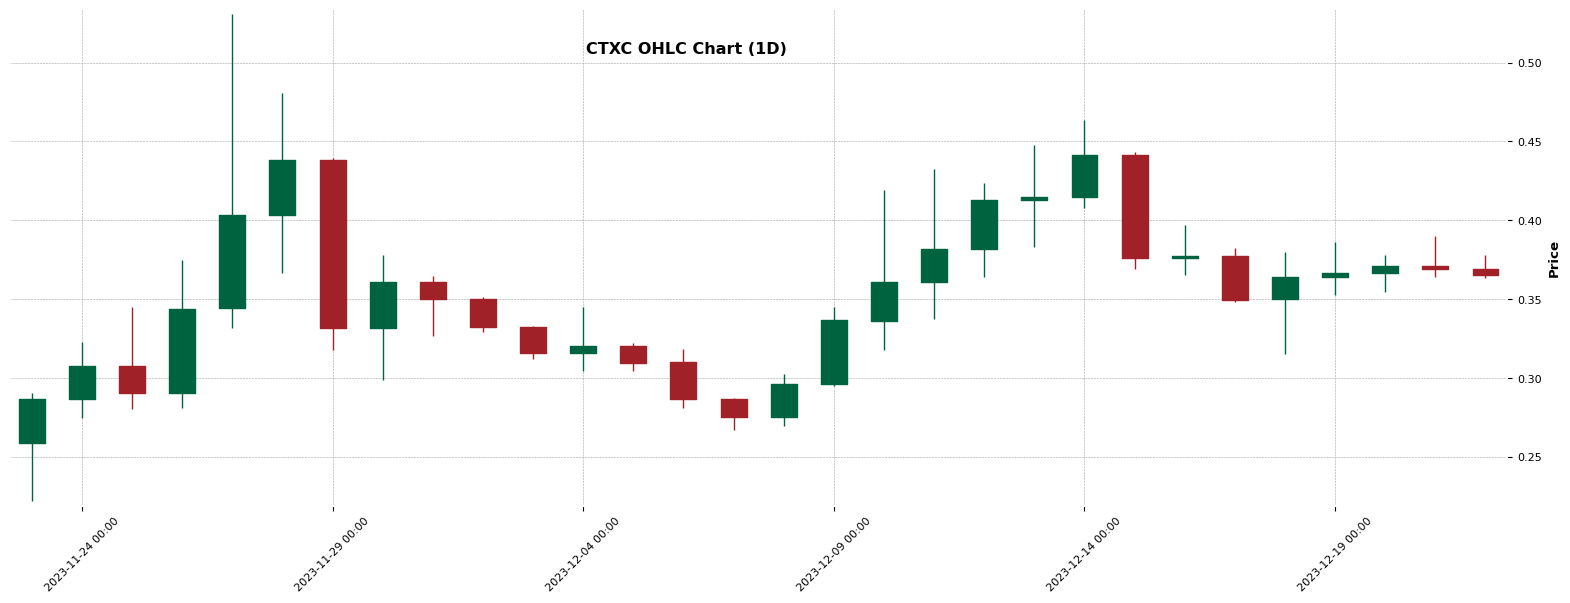
CTXC – Triangle identified (1H)
Chart Pattern Information
The CTXC hourly chart shows a potentially developing Triangle pattern. On December 21, 2023, the price fluctuated between 0.3903 at 09:00:00 and 0.3638 at 15:00:00. It then peaked at 0.3782 at 01:00:00 on December 22, before falling back to 0.3645 by 06:00:00. The intersect time and price are anticipated to be at 17:00:00 on December 22, 2023, at the price of 0.3650764919564086. However, this chart pattern is still in its formation and considered incomplete until it matures. Pattern typology remains unknown at this stage with no details on entry points and profit predictions.
About CTXC
Cortex (CTXC) is a cryptocurrency . Users are able to generate CTXC through the process of mining. Cortex has a current supply of 299,792,458 with 217,377,478.234375 in circulation. The last known price of Cortex is 0.366 USD and is down -4.41 over the last 24 hours. It is currently trading on 40 active market(s) with $10,222,083.54 traded over the last 24 hours. More information can be found at http://www.cortexlabs.ai/.
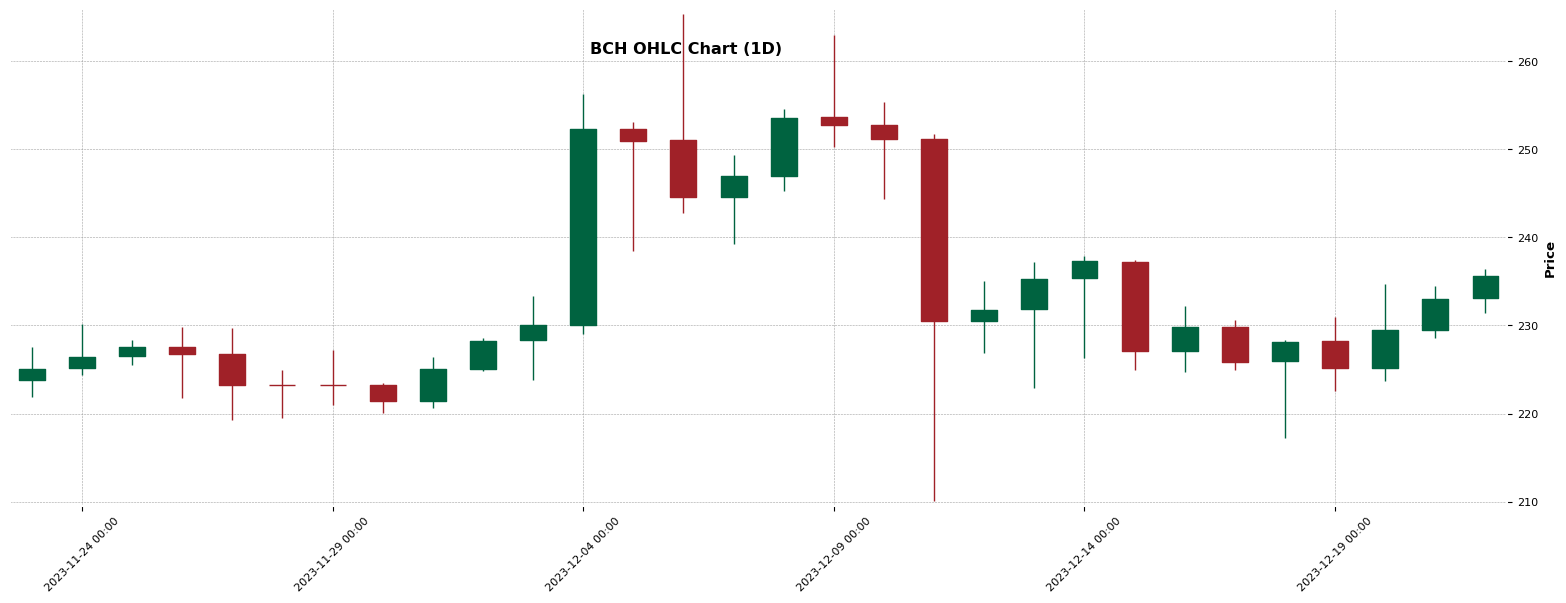
BCH – Triple Top identified (1H)
Chart Pattern Information
The BCH hourly chart is currently demonstrating the formation of a ‘Triple Top’ pattern, a potentially bearish signal. At 10:00 on December 20, 2023, the price started at 225.49, peaking at 234.7 (at 15:00), dipping to 226.7 (at 20:00), and then rebounding to 234.5 by 12:00 the following day. However, by 15:00, the price decreased to 229, ending up at 229.61 at 20:00. Although the pattern is incomplete as of 01:00 on December 22, 2023 (with an observed price of 235.7), an impending entrance is poised at 229.61, with a stop loss at 236.6 and a profit of 222.61 predicted.
About BCH
Bitcoin Cash (BCH) is a cryptocurrency . Users are able to generate BCH through the process of mining. Bitcoin Cash has a current supply of 19,591,868.75. The last known price of Bitcoin Cash is 234 USD and is up 1.57 over the last 24 hours. It is currently trading on 822 active market(s) with $190,845,766.24 traded over the last 24 hours. More information can be found at http://bch.info.
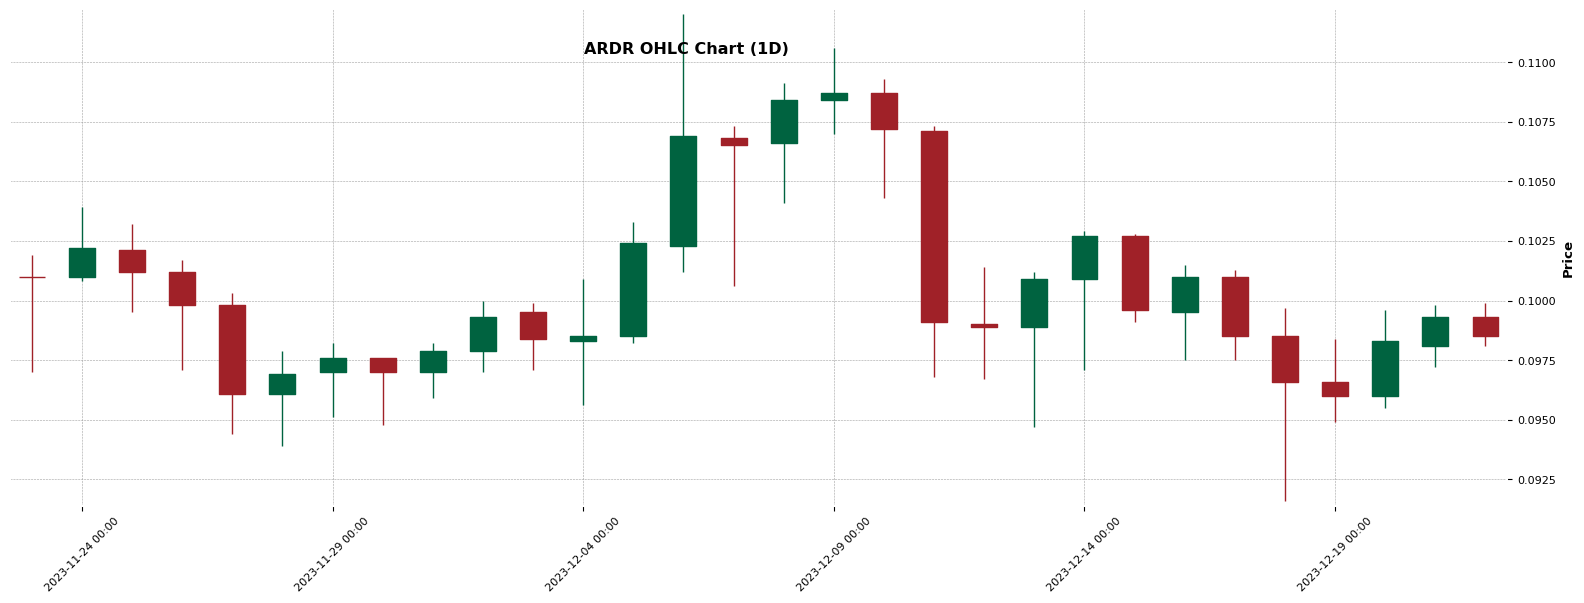
ARDR – Triple Top identified (1H)
Chart Pattern Information
The ARDR hourly chart is currently forming a ‘Triple Top’, a bearish pattern that signals a potential reversal of an uptrend. From a start price of 0.0972 at 10:00 on 20th Dec, 2023, ARDR peaked at 0.0996 and 0.0998 before falling to 0.0972 again. It is not yet mature, hence, it is imperative to note that the pattern remains incomplete. If this formation completes, potential profits lie around 0.0942, with an anticipated stoploss at 0.1002. This analysis is time sensitive and relevant in the short-term, given it’s on the hourly timeframe.
About ARDR
Ardor (ARDR) is a cryptocurrency . Ardor has a current supply of 998,999,495. The last known price of Ardor is 0.0987 USD and is down -0.97 over the last 24 hours. It is currently trading on 34 active market(s) with $2,896,388.76 traded over the last 24 hours. More information can be found at https://www.jelurida.com/ardor.
LOOM – Triple Top identified (1H)
Chart Pattern Information
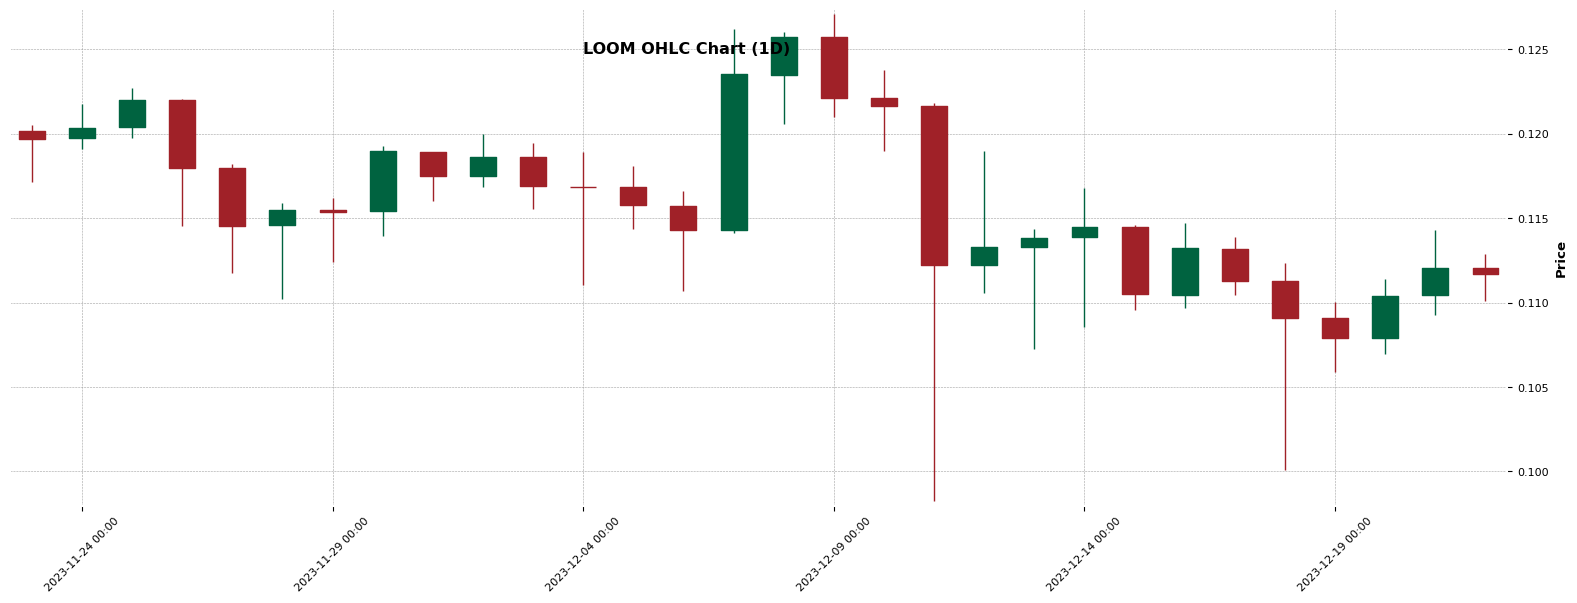
The hourly chart of LOOM indicates that a ‘Triple Top’ pattern is currently in the process of forming. As of December 21, 2023, the pattern remains incomplete, suggesting that the asset’s price is likely to follow a bearish trend. Notably, the pattern started forming at 0.106739 on December 20 and reached a high of 0.11430 on December 21. As the pattern matures, investors could potentially anticipate a dip to around 0.1044. However, the stop-loss is set at 0.115, indicating that swift recovery measures are in place to minimize any potential losses. It’s essential to validate the pattern upon completion.
About LOOM
Loom Network (LOOM) is a cryptocurrency and operates on the Ethereum platform. Loom Network has a current supply of 1,300,000,000 with 1,219,425,697.5790398 in circulation. The last known price of Loom Network is 0.111 USD and is down -0.11 over the last 24 hours. It is currently trading on 132 active market(s) with $18,020,704.16 traded over the last 24 hours. More information can be found at https://loomx.io/.
KMD – Double Top identified (1H)
Chart Pattern Information
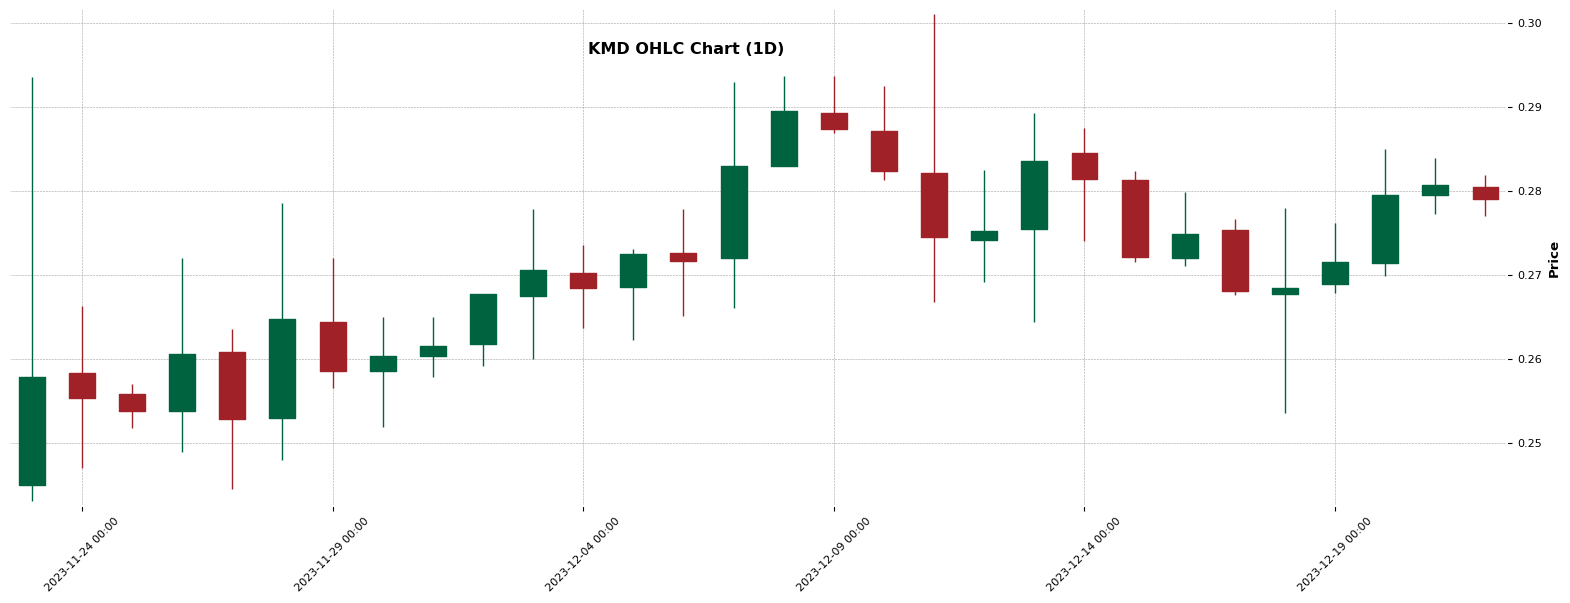
A bearish ‘Double Top’ pattern appears to be forming on the KMD hourly chart on December 20th, 2023, starting at 0.2763 at 15:00, rising to 0.285 at 17:00, and descending back to 0.2763 by 21:00. The pattern moderately recovered to 0.2839 at midnight but had not reached maturity by the end of the dataset at 01:00 on December 22nd, where it remained at the entry price of 0.2763. The stop loss is set at 0.2859. Once completed, the potential profits could reach 0.2676. Please note that this is an ongoing pattern and still considered as incomplete.
About KMD
Komodo (KMD) is a cryptocurrency . Users are able to generate KMD through the process of mining. Komodo has a current supply of 136,870,414.02116 with 135,953,876.01938 in circulation. The last known price of Komodo is 0.28 USD and is down -0.62 over the last 24 hours. It is currently trading on 42 active market(s) with $710,787.78 traded over the last 24 hours. More information can be found at https://komodoplatform.com/.
GTC – Double Top identified (1H)
Chart Pattern Information
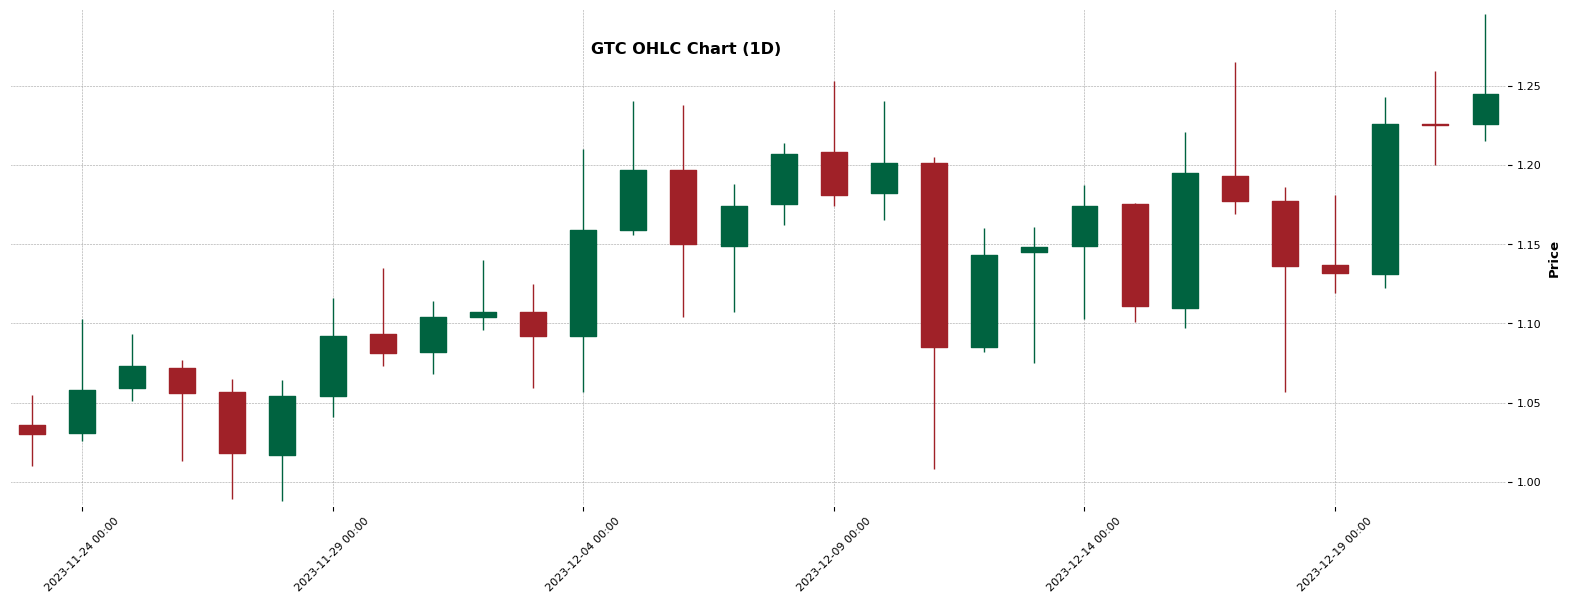
The GTC is potentially shaping a “Double Top” pattern, which is a bearish chart formation on the hourly chart. It started forming on 2023-12-20 at 14:00 with an initial price of 1.194. The pattern saw a high of 1.243 at 17:00 on the same day, then decreased to 1.194 at 20:00 before again increasing to 1.259 on the next day at 09:00. The pattern is still incomplete as it aims to reach an entry point of 1.194. Keep an eye on it as it might complete around 2023-12-22 at 01:00, with a proposed stop loss at 1.2655 and a potential profit1 at 1.129.
About GTC
Gitcoin (GTC) is a cryptocurrency and operates on the Ethereum platform. Gitcoin has a current supply of 100,000,000 with 66,291,053.56069586 in circulation. The last known price of Gitcoin is 1.24 USD and is down -0.50 over the last 24 hours. It is currently trading on 116 active market(s) with $11,031,663.10 traded over the last 24 hours. More information can be found at https://gitcoin.co/.
ETH – Double Top identified (1H)
Chart Pattern Information
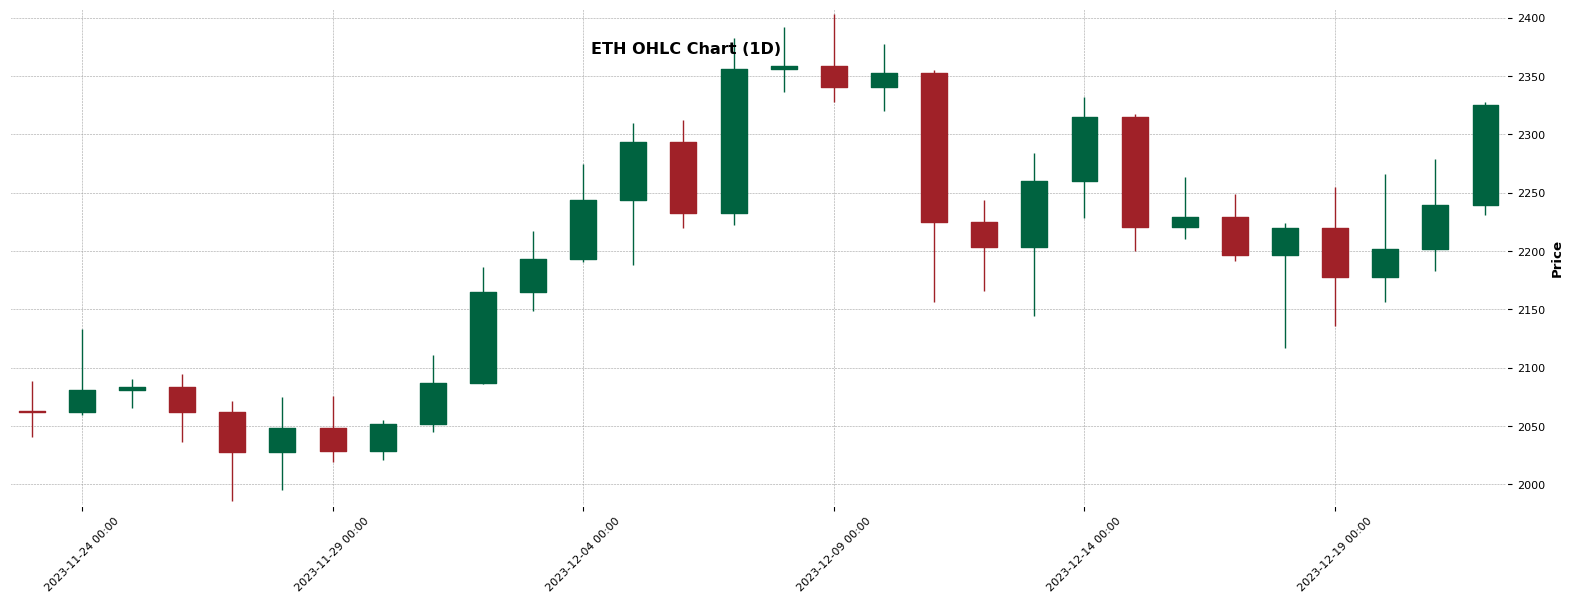
The ETH hourly chart is currently forming a “Double Top” pattern, signaling a potential bearish trend. The formation started at an entry point of 2201 on 2023-12-21 at 06:00:00 with a peak at 2279.31 at 12:00:00 the same day. Afterwards, it dipped to 2201 at 15:00:00 and rose again to 2262.83 at 21:00:00. As of now, this pattern is incomplete with an end price of 2201 on this day at 01:00:00. If completed, the expected profit would be 2122.69 with a stop loss at 2287.141. Always remember, the chart is still in the process of forming.
About ETH
Ethereum (ETH) is a cryptocurrency . Ethereum has a current supply of 120,184,983.36235134. The last known price of Ethereum is 2,310 USD and is up 4.39 over the last 24 hours. It is currently trading on 8083 active market(s) with $16,103,158,920.24 traded over the last 24 hours. More information can be found at https://www.ethereum.org/.
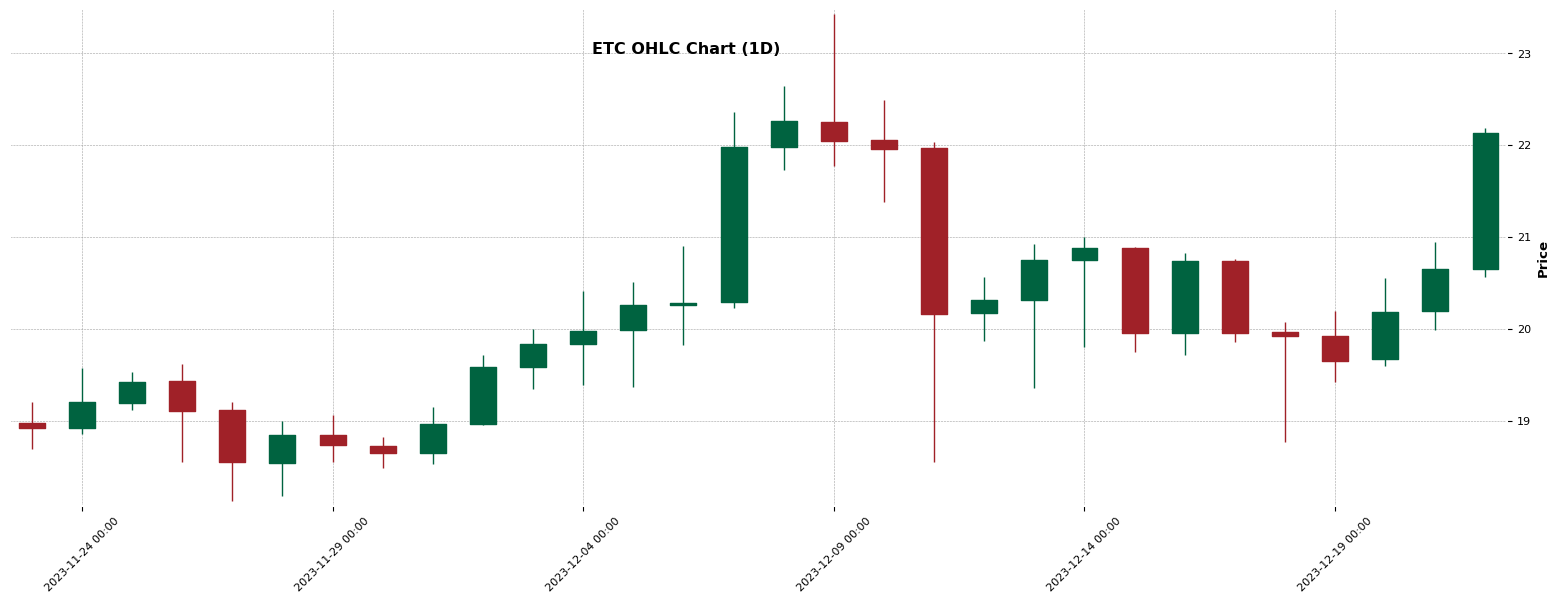
ETC – Head And Shoulders identified (1H)
Chart Pattern Information
At the time of analysis, a potential ‘Head And Shoulders’ chart pattern is developing on the hourly ETC data. This is a bearish pattern that began forming at 09:00 on 20th December 2023, with a start price of 19.59. The pattern saw its highest point at 20.94 around noon on 21st December and suggests a possible downturn, targeting a profit level of 19.527. Currently, the pattern, with an entry point at 20.29 and stop loss at 21.053, is not fully matured and remains incomplete. Traders should continue monitoring for potential bearish shifts in the market.
About ETC
Ethereum Classic (ETC) is a cryptocurrency . Users are able to generate ETC through the process of mining. Ethereum Classic has a current supply of 210,700,000 with 144,647,760.81045485 in circulation. The last known price of Ethereum Classic is 21.95 USD and is up 8.16 over the last 24 hours. It is currently trading on 480 active market(s) with $340,914,634.34 traded over the last 24 hours. More information can be found at https://ethereumclassic.org/.
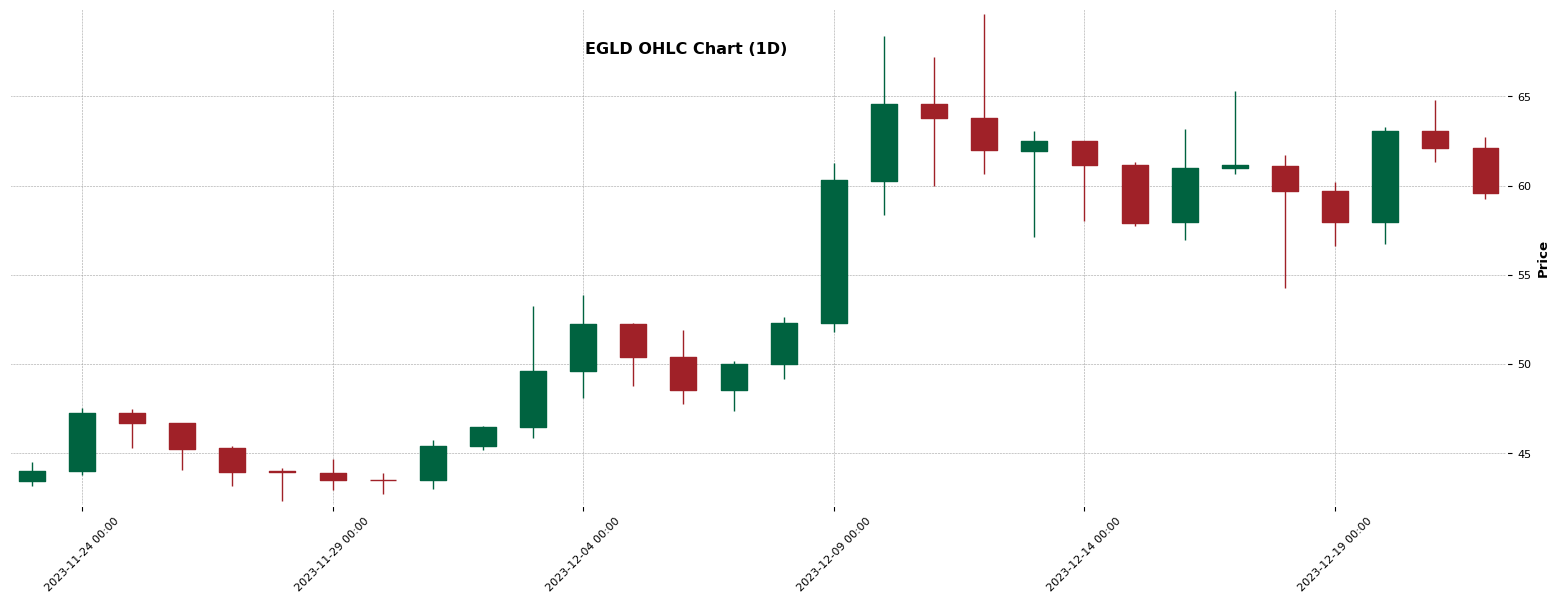
EGLD – Double Top identified (1H)
Chart Pattern Information
The EGLD hourly chart appears to be forming an incomplete Double Top pattern, indicating a potential bearish shift. Starting at a price of $60.41 at 13:00 on December 20th, 2023, we saw a peak (A) at $63.23 at 18:00. It then fell to $60.41 (B) by 20:00, and rose again to a second peak (C) at $64.81 on 10:00, December 21st. Currently, the pattern is anticipated to complete at the same initial level, aiming at a profit of $56.01. As this pattern is still forming, it’s essential to monitor for any changes. The suggested stop loss is set at $65.25.
About EGLD
MultiversX (EGLD) is a cryptocurrency . MultiversX has a current supply of 26,360,391 with 26,355,239 in circulation. The last known price of MultiversX is 59.47 USD and is down -6.98 over the last 24 hours. It is currently trading on 210 active market(s) with $68,839,881.38 traded over the last 24 hours. More information can be found at https://multiversx.com/.
For more chart patterns, trading signals, and crypto data, download our app in the Appstore or Playstore: Download Now