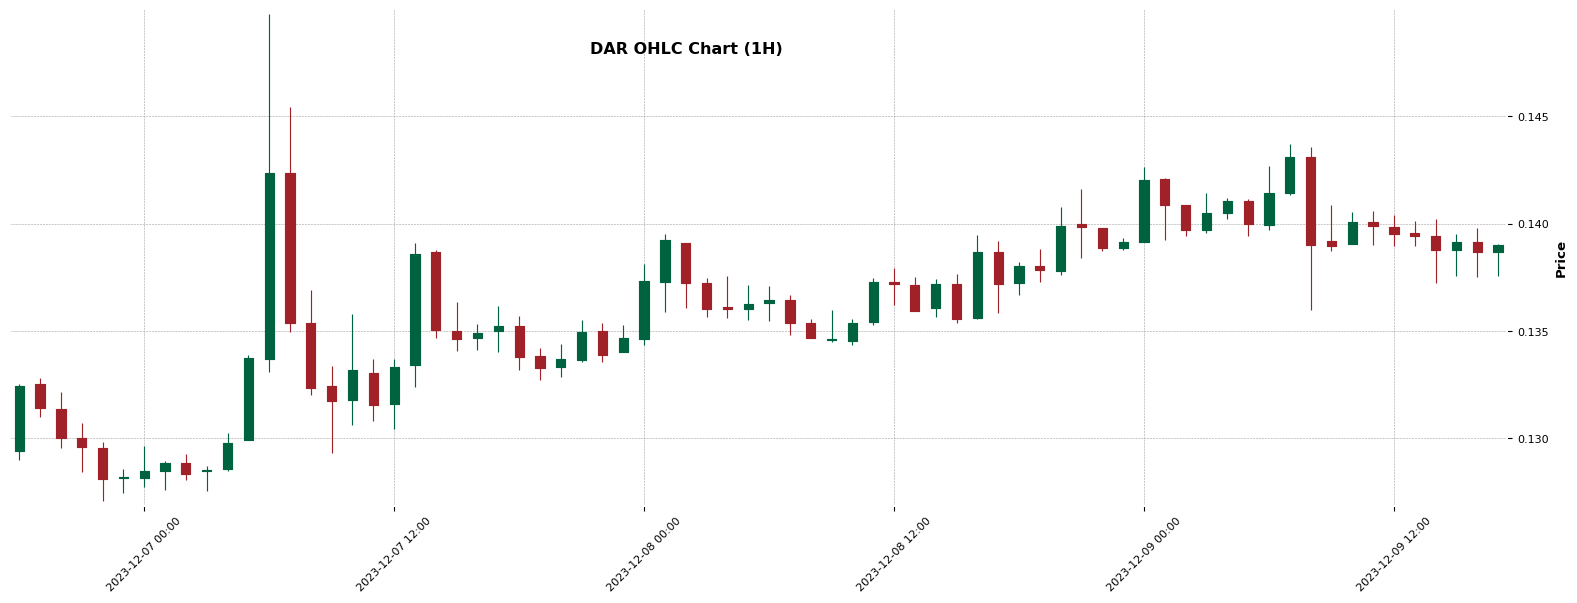
DAR – Triangle identified (1H)
Chart Pattern Information
A Triangle chart pattern is currently forming on the hourly chart for DAR. The pattern started with a price of 0.14977 at 06:00:00 on 2023-12-07. By 09:00:00, the price decreased to 0.12931. It experienced a slight increase to 0.14374 on 2023-12-09 at 07:00:00 but then dropped slightly to 0.136 at 08:00:00 the same day. The pattern is expected to intersect at a price of 0.14008512270540885 on 2023-12-10 at 11:00:00. It’s essential to watch this pattern as it matures. Currently, it is still in the process of forming, and its status remains incomplete.
About DAR
Mines of Dalarnia (DAR) is a cryptocurrency launched in 2021and operates on the Ethereum platform. Mines of Dalarnia has a current supply of 800,000,000 with 398,953,623 in circulation. The last known price of Mines of Dalarnia is 0.13803265 USD and is up 0.71 over the last 24 hours. It is currently trading on 125 active market(s) with $21,467,052.14 traded over the last 24 hours. More information can be found at https://www.minesofdalarnia.com/.
CVC – Double Top identified (1H)
Chart Pattern Information
The data indicates the potential formation for a Double Top chart pattern on the hourly CVC trading chart. This bearish pattern began on 2023-12-08 at 17:00:00 with a start price of 0.1156, and is currently incomplete. The pattern went on to build up an apex price of 0.118 by 18:00:00 on the same day, followed by a subsequent recovery at 0.119 by 08:00:00 the next day. A stop loss is set at 0.1193. The pattern will ideally complete with an end price of 0.1156 on 2023-12-09 at 16:00:00. Please note that these patterns are only potential scenarios and trading decisions should be made wisely.
About CVC
Civic (CVC) is a cryptocurrency and operates on the Ethereum platform. Civic has a current supply of 1,000,000,000. The last known price of Civic is 0.11697008 USD and is up 1.35 over the last 24 hours. It is currently trading on 128 active market(s) with $12,725,607.17 traded over the last 24 hours. More information can be found at https://www.civic.com/.

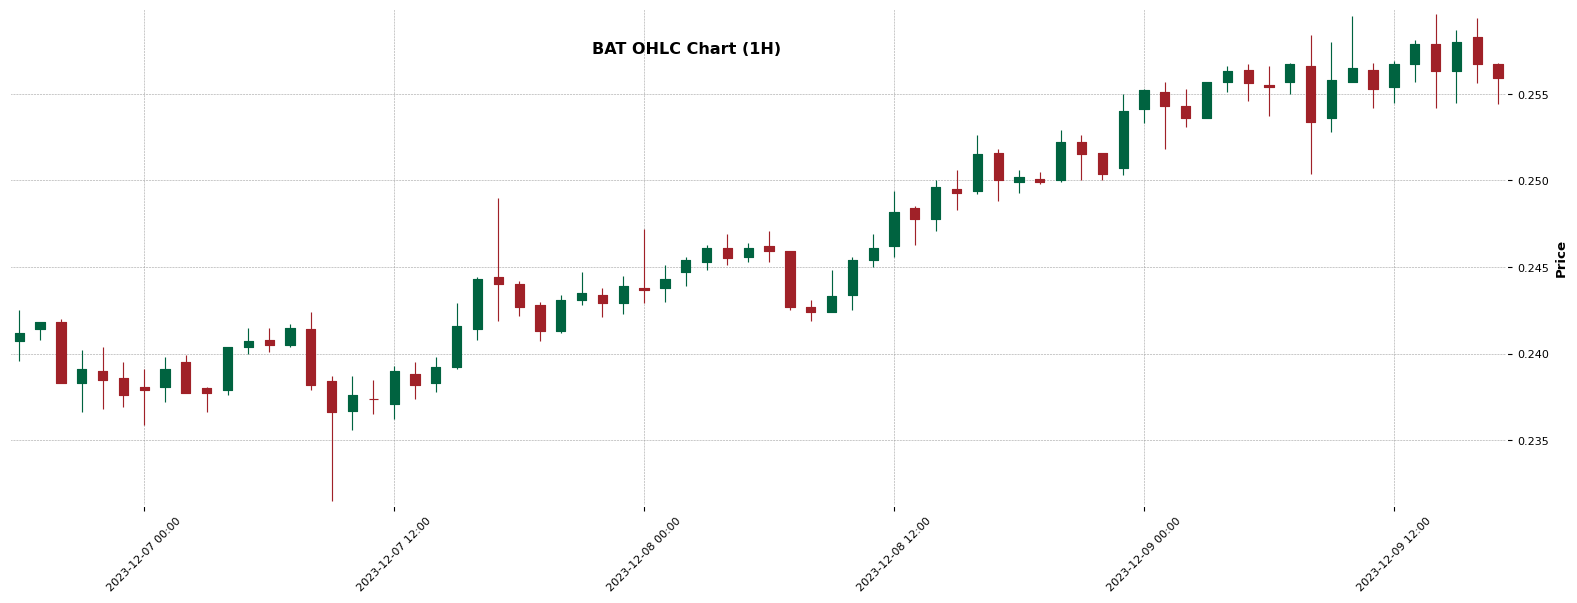
BAT – Triangle identified (1H)
Chart Pattern Information
A potential ‘Triangle’ pattern is currently building on the hourly chart of BAT. The pattern’s formation started on December 4, 2023, with a price of $0.2244 at 11:00:00 and reached $0.2599 by 13:00:00. On December 7, the price corrected to $0.2315 at 09:00:00, and by December 9, it rebounded close to the initial high at $0.2596 at 14:00:00. The intersect price is around $0.25905777 and is expected to occur by December 18, 15:00:00. However, this pattern is still in the forming stage, and it has a maturity status marked as 1, indicating it’s incomplete. The pattern’s ultimate type and impact remain unknown at this moment.
About BAT
Basic Attention Token (BAT) is a cryptocurrency and operates on the Ethereum platform. Basic Attention Token has a current supply of 1,500,000,000 with 1,490,413,700.9526057 in circulation. The last known price of Basic Attention Token is 0.25570507 USD and is up 2.20 over the last 24 hours. It is currently trading on 423 active market(s) with $37,990,662.74 traded over the last 24 hours. More information can be found at https://basicattentiontoken.org/.
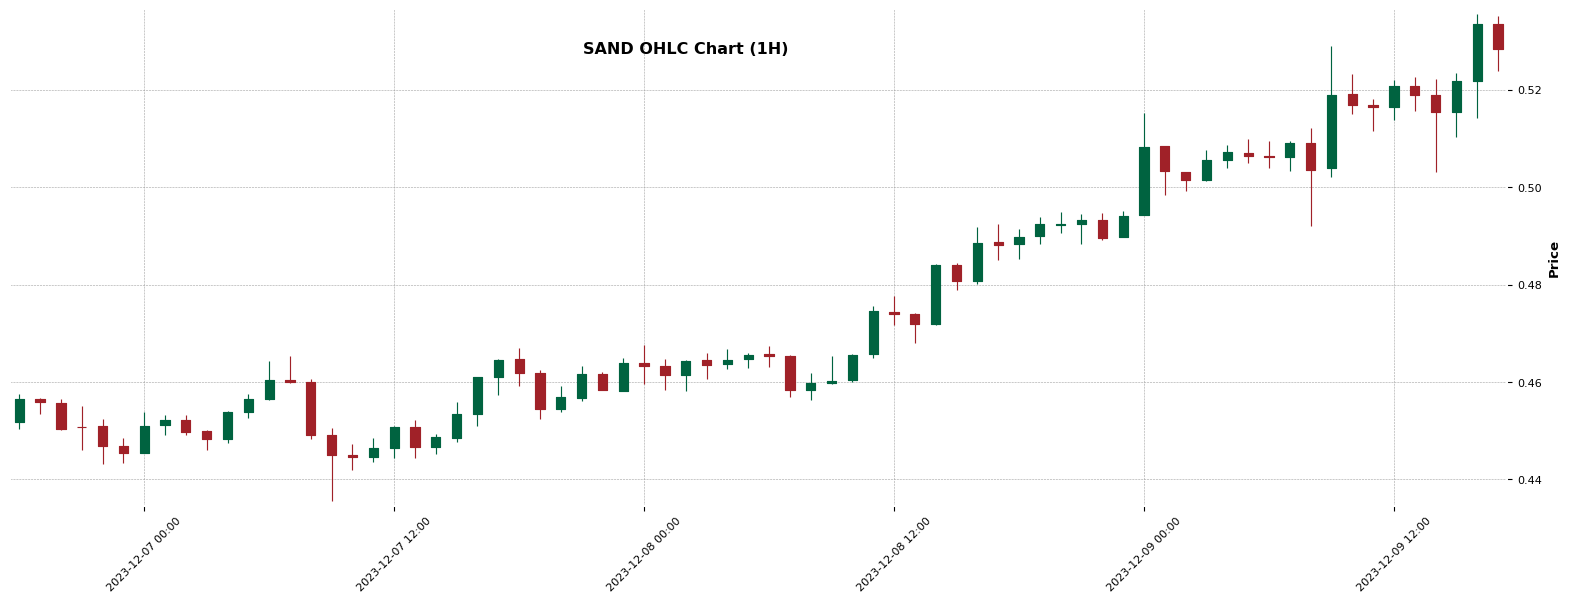
SAND – Double Top identified (1H)
Chart Pattern Information
The SAND hourly chart is currently in the process of forming a bearish ‘Double Top’ pattern. The initial peak was observed at a price of 0.5152 at midnight on December 9, 2023, followed by a drop to 0.492 within the next 8 hours. The chart then rebounded, reaching 0.529 within the hour, but it has since declined to 0.492 by 2 PM. This pattern suggests a downward trend. However, bear in mind that as it stands, the chart is still incomplete, indicating further potential changes. A stop loss is advised at 0.5327, with an initial profit target set at 0.455.
About SAND
The Sandbox (SAND) is a cryptocurrency and operates on the Ethereum platform. The Sandbox has a current supply of 3,000,000,000 with 2,101,731,926.2233226 in circulation. The last known price of The Sandbox is 0.52717246 USD and is up 8.32 over the last 24 hours. It is currently trading on 465 active market(s) with $266,438,752.19 traded over the last 24 hours. More information can be found at https://www.sandbox.game/en/.
BICO – Double Top identified (1H)
Chart Pattern Information
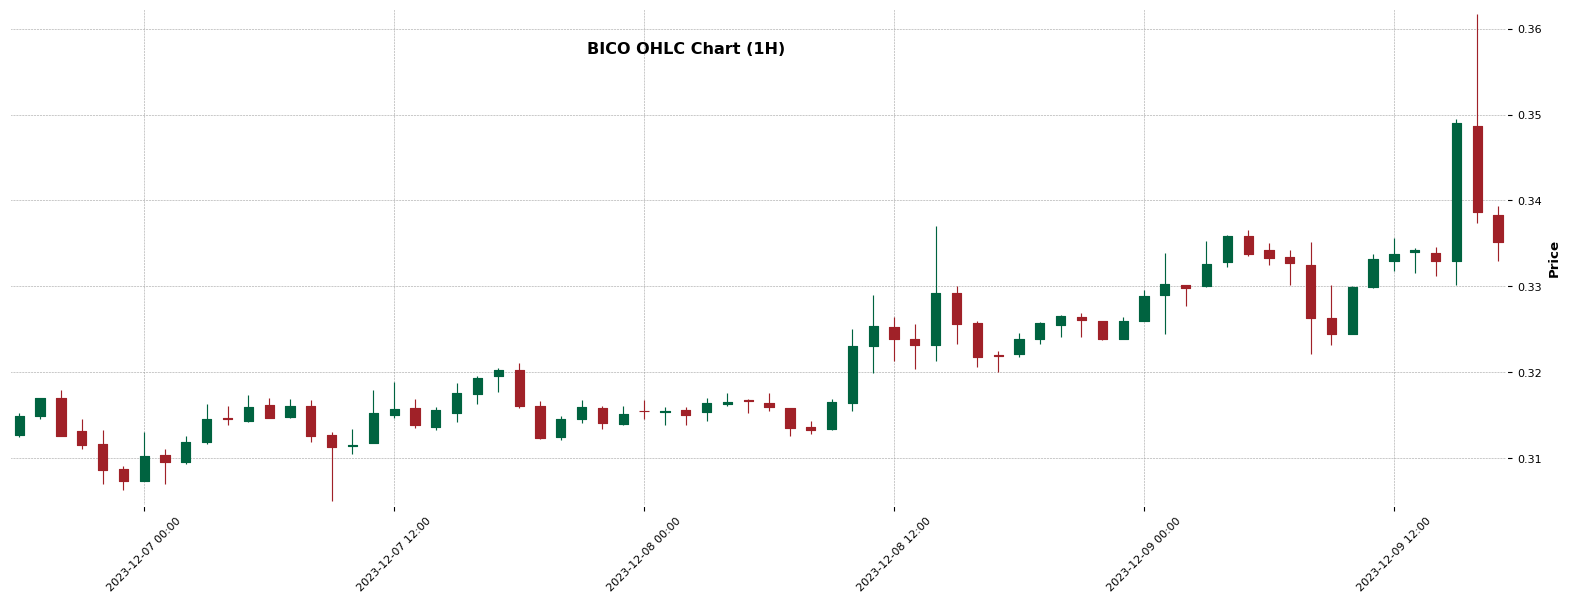
The BICO’s hourly chart is currently exhibiting a potential ‘Double Top’ pattern. This bearish pattern denotes a potential reversal or correction after an uptrend. The pattern started forming on 2023-12-08 at 11:00 with a starting price of 0.32. The first top formed at a price of 0.337 on 14:00 the same day, followed by a second top at 0.3365 on 2023-12-09 at 05:00. A potential entry point could be at 0.32 if the pattern matures. Be aware this chart is still pending completion. As precaution, a stop loss is advised at 0.3387. Profit targets are set at 0.303.
About BICO
Biconomy (BICO) is a cryptocurrency launched in 2021and operates on the Ethereum platform. Biconomy has a current supply of 1,000,000,000 with 710,771,393.0507152 in circulation. The last known price of Biconomy is 0.33637455 USD and is up 4.89 over the last 24 hours. It is currently trading on 98 active market(s) with $9,690,055.83 traded over the last 24 hours. More information can be found at https://biconomy.io.
FLOKI – Triangle identified (1H)
Chart Pattern Information
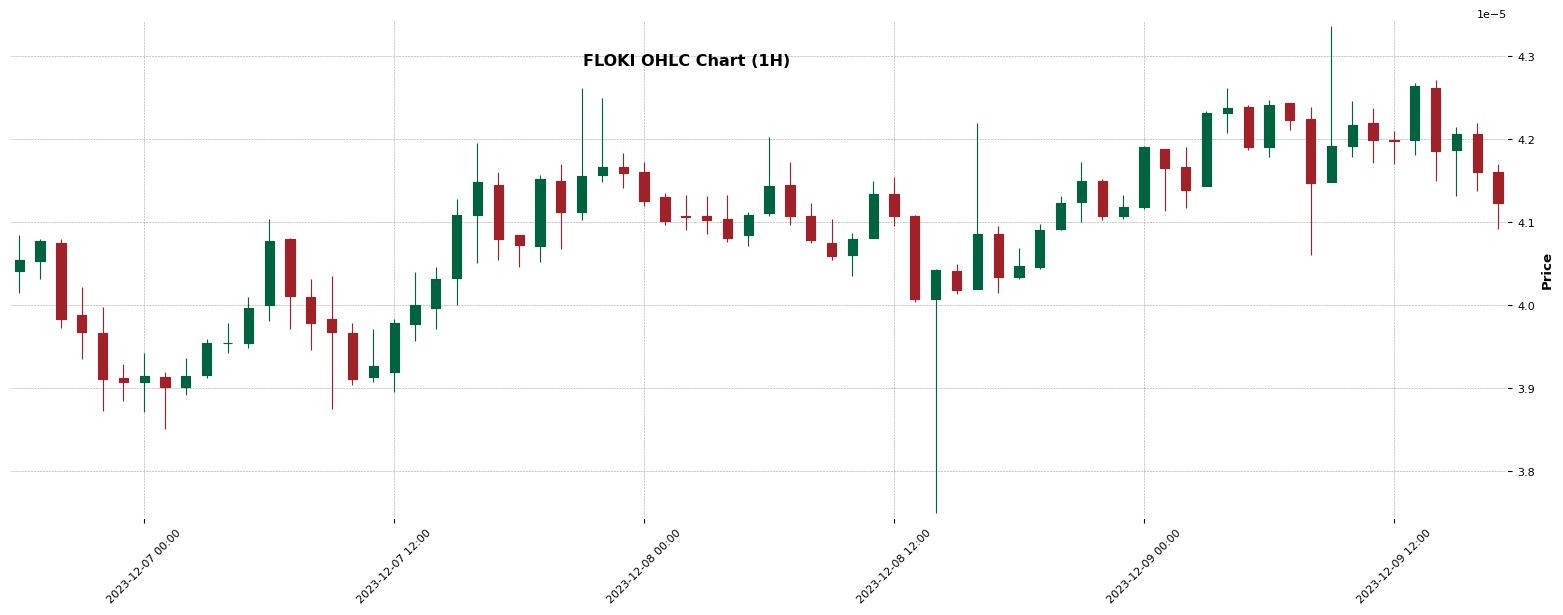
FLOKI is potentially forming a ‘Triangle’ chart pattern on the hourly chart with an immature status. The pattern started its formation on ‘2023-12-05 08:00:00’ with a price of 3.74e-05 and saw a peak at 4.75e-05 on ‘2023-12-05 12:00:00’. Since then, the price has fluctuated and is projected to intersect at 3.768771898139786e-05 on ‘2023-12-14 15:00:00’. However, this being an ‘unknown’ type, precision in prediction may not be absolute. Hence, further observation is recommended until the pattern is complete for better investment decisions. Please note, this information is based on past data and does not guarantee future performance.
About FLOKI
FLOKI (FLOKI) is a cryptocurrency launched in 2021and operates on the Ethereum platform. FLOKI has a current supply of 9,935,177,101,348.91 with 9,505,942,524,007.479 in circulation. The last known price of FLOKI is 0.00004134 USD and is up 1.92 over the last 24 hours. It is currently trading on 350 active market(s) with $39,360,549.52 traded over the last 24 hours. More information can be found at https://floki.com/.
ALPACA – Double Top identified (1H)
Chart Pattern Information
The ALPACA hourly chart shows the tentative formation of a bearish ‘Double Top’ pattern as of December 08, 2023. The pattern initiated at 0.195 at 07:00:00, peaked to 0.2049 at 08:00:00, retraced to 0.195 at 13:00:00, and rebounded to 0.2088 at 23:00:00. It currently remains incomplete with a potential end price of 0.195 on December 09, 2023, at 13:00:00. If the pattern reaches maturity, an entry point of 0.195 could yield profits to approximately 0.1812, should the price falls. A stop loss recommendation sits at 0.2102 as a cautious measure to limit potential losses.
About ALPACA
Alpaca Finance (ALPACA) is a cryptocurrency launched in 2021and operates on the BNB Smart Chain (BEP20) platform. Alpaca Finance has a current supply of 150,240,044.3637145. The last known price of Alpaca Finance is 0.19797915 USD and is down -1.82 over the last 24 hours. It is currently trading on 119 active market(s) with $4,431,687.62 traded over the last 24 hours. More information can be found at https://www.alpacafinance.org/.

IRIS – Triple Top identified (1H)
Chart Pattern Information
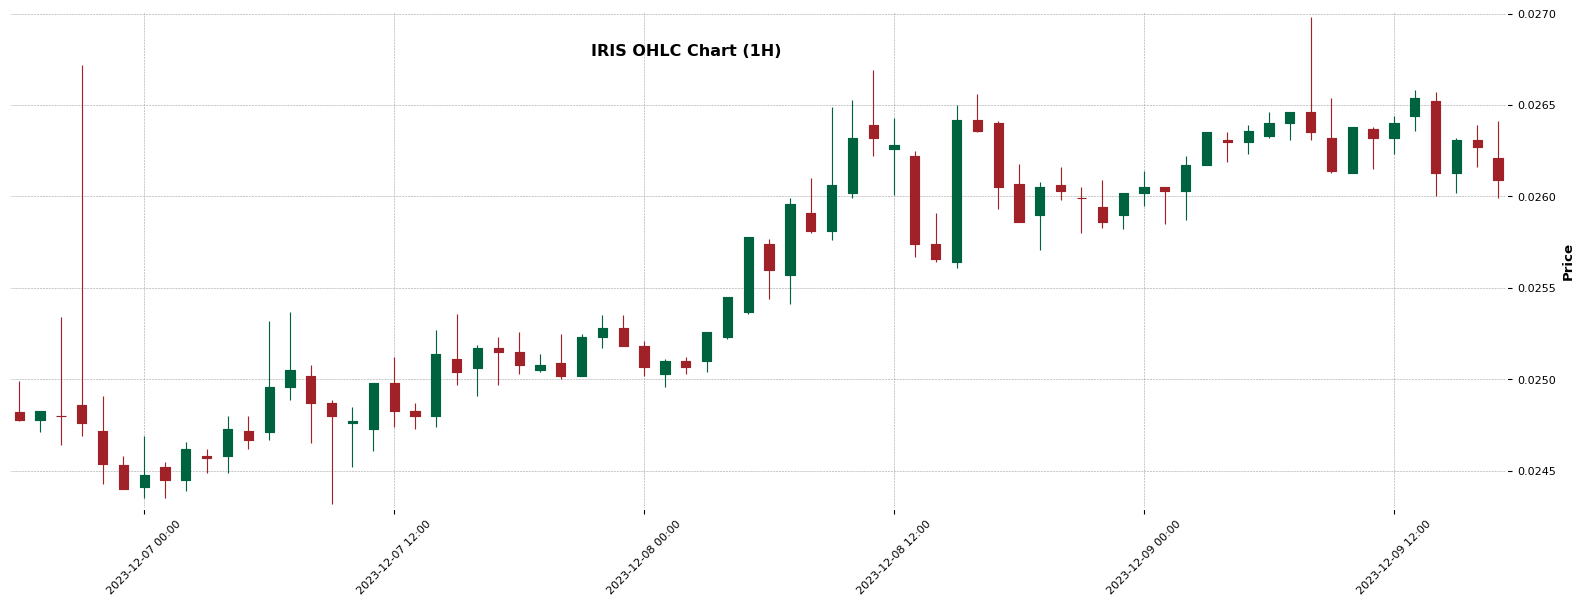
The IRIS hourly chart suggests a ‘Triple Top’ pattern is potentially forming; known for its bearish implications. Starting at a price of 0.025385 on ‘2023-12-08 06:00:00′, the pattern oscillated with high points at ’11:00:00′ (0.02669) and ’16:00:00′ (0.02656), and a low point at ’15:00:00’ (0.02561). This developing pattern, with an entry point of 0.0258, projects a profit1 target at 0.0246 and a stop loss at 0.0271. As of ‘2023-12-09 00:00:00’, the ending price stood at 0.025834999999999997. Reminder, this pattern is still maturing, hence its status, ‘incomplete’. Approach with insight.
About IRIS
IRISnet (IRIS) is a cryptocurrency . IRISnet has a current supply of 2,176,720,555.289199 with 1,531,015,339.77213 in circulation. The last known price of IRISnet is 0.0262216 USD and is down -0.59 over the last 24 hours. It is currently trading on 43 active market(s) with $1,062,966.24 traded over the last 24 hours. More information can be found at https://www.irisnet.org/.
LOKA – Double Top identified (1H)
Chart Pattern Information
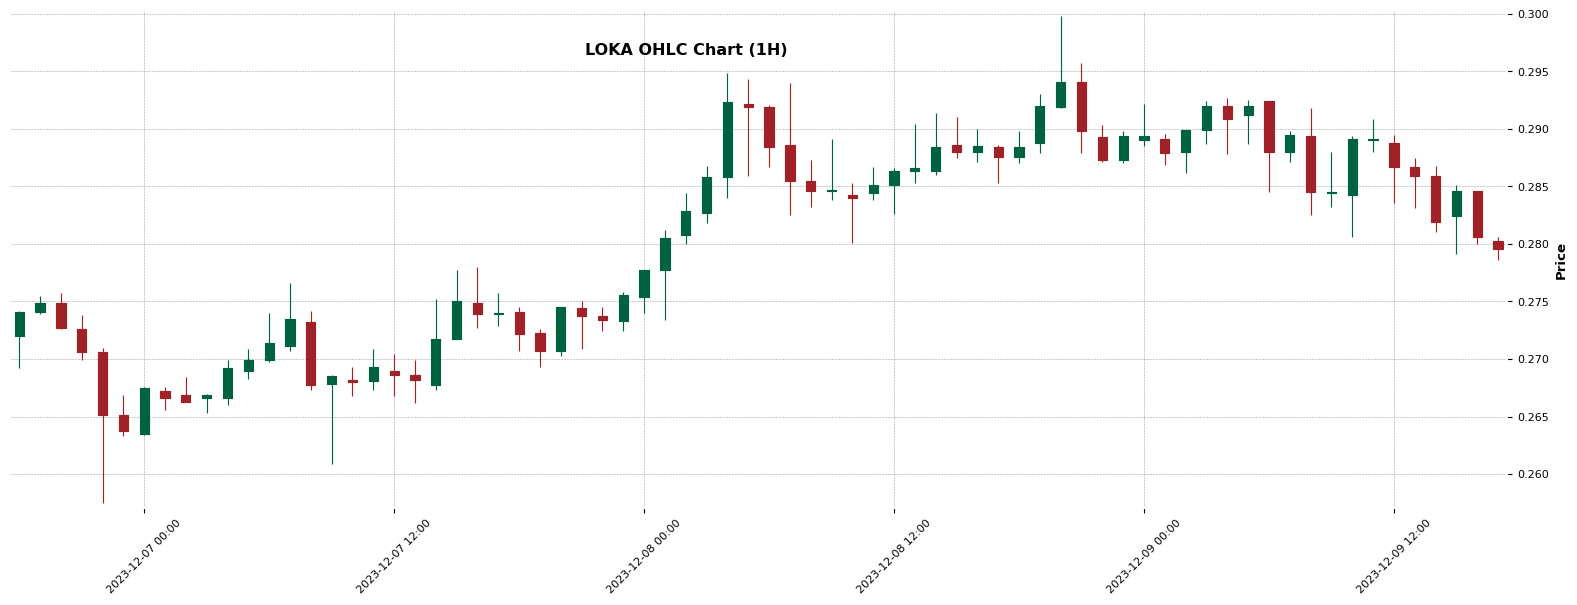
A bearish Double Top pattern is currently in the process of forming for LOKA on the hourly chart, according to data up to Dec 8, 2023, 20:00:00. This pattern started forming at 0.2801 and hit a peak of 0.2998. Please note the pattern remains incomplete as of the last recorded time. If it matures, potential profit from shorting could be attained at 0.2604 after entry at 0.2801. However, carefully watch the price levels as a stop-loss order would be advisable at 0.3018, limiting potential losses if the pattern reverses unexpectedly.
About LOKA
League of Kingdoms Arena (LOKA) is a cryptocurrency launched in 2022and operates on the Ethereum platform. League of Kingdoms Arena has a current supply of 197,769,307.41927272 with 73,874,861.14654545 in circulation. The last known price of League of Kingdoms Arena is 0.28008975 USD and is down -2.54 over the last 24 hours. It is currently trading on 54 active market(s) with $4,657,131.26 traded over the last 24 hours. More information can be found at https://www.leagueofkingdoms.com/.
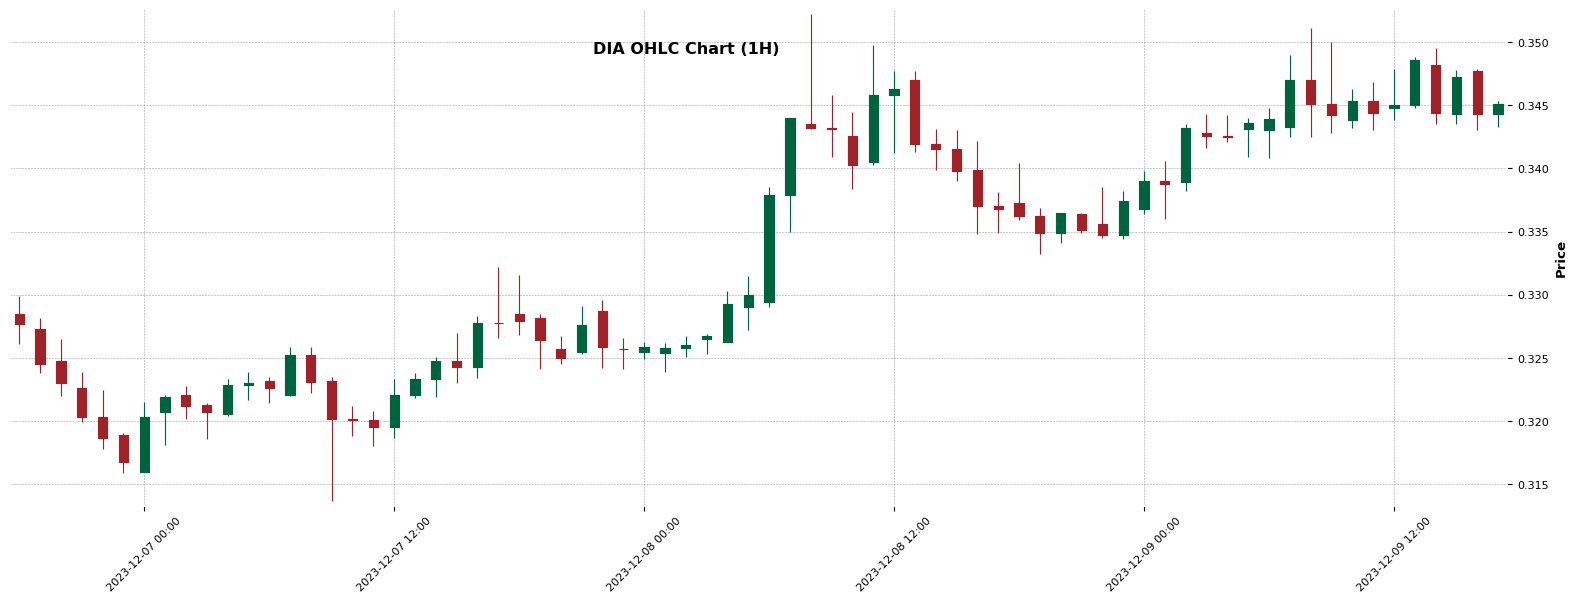
DIA – Double Top identified (1H)
Chart Pattern Information
A potential ‘Double Top’ pattern is developing on the hourly chart of DIA. This bearish chart pattern started forming on 2023-12-08 at 06:00:00 with a start price of 0.3332 and has shown significant activity until 08:00:00 the following day with a peak price of 0.3511. Whilst the pattern is not yet mature, it’s important to note that it could indicate a market reversal. The preliminary stop loss is set at 0.3541 and the anticipated profit target is 0.3142. The status remains ‘incomplete’ as we continue to observe the pattern’s development. Please exercise discretion and monitor the market accordingly.
About DIA
DIA (DIA) is a cryptocurrency and operates on the Ethereum platform. DIA has a current supply of 168,817,248 with 110,617,604 in circulation. The last known price of DIA is 0.34429721 USD and is up 2.04 over the last 24 hours. It is currently trading on 86 active market(s) with $6,296,855.21 traded over the last 24 hours. More information can be found at https://diadata.org/.