For more chart patterns, trading signals, and crypto data, download our app in the Appstore or Playstore: Download Now
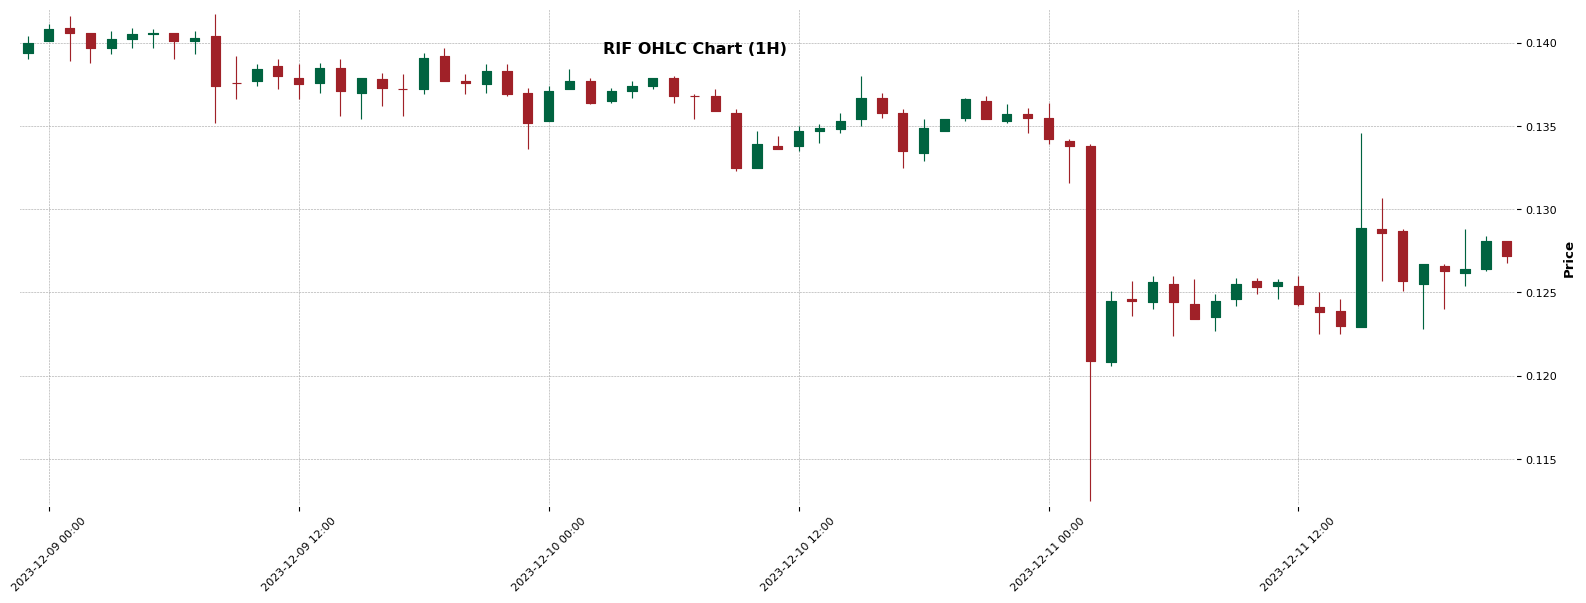
RIF – Triangle identified (1H)
Chart Pattern Information
The RIF token is potentially forming an incomplete ‘Triangle’ pattern on the hourly chart. The pattern started taking shape on December 10, 2023, at 21:00, with a price of $0.1368, and is currently in process of forming. The subsequent highs and lows occurred at varying times, with the lowest being $0.1125, and the highest rebound at $0.1346. The pattern’s intersect time is predicted to be December 12, 2023, at 07:00, with a price of $0.1324. Please note that this information is subject to change as the chart pattern continues to mature.
About RIF
Rootstock Infrastructure Framework (RIF) is a cryptocurrency launched in 2018and operates on the RSK RBTC platform. Rootstock Infrastructure Framework has a current supply of 1,000,000,000. The last known price of Rootstock Infrastructure Framework is 0.1273 USD and is down -6.24 over the last 24 hours. It is currently trading on 56 active market(s) with $10,385,888.48 traded over the last 24 hours. More information can be found at https://rif.technology/.
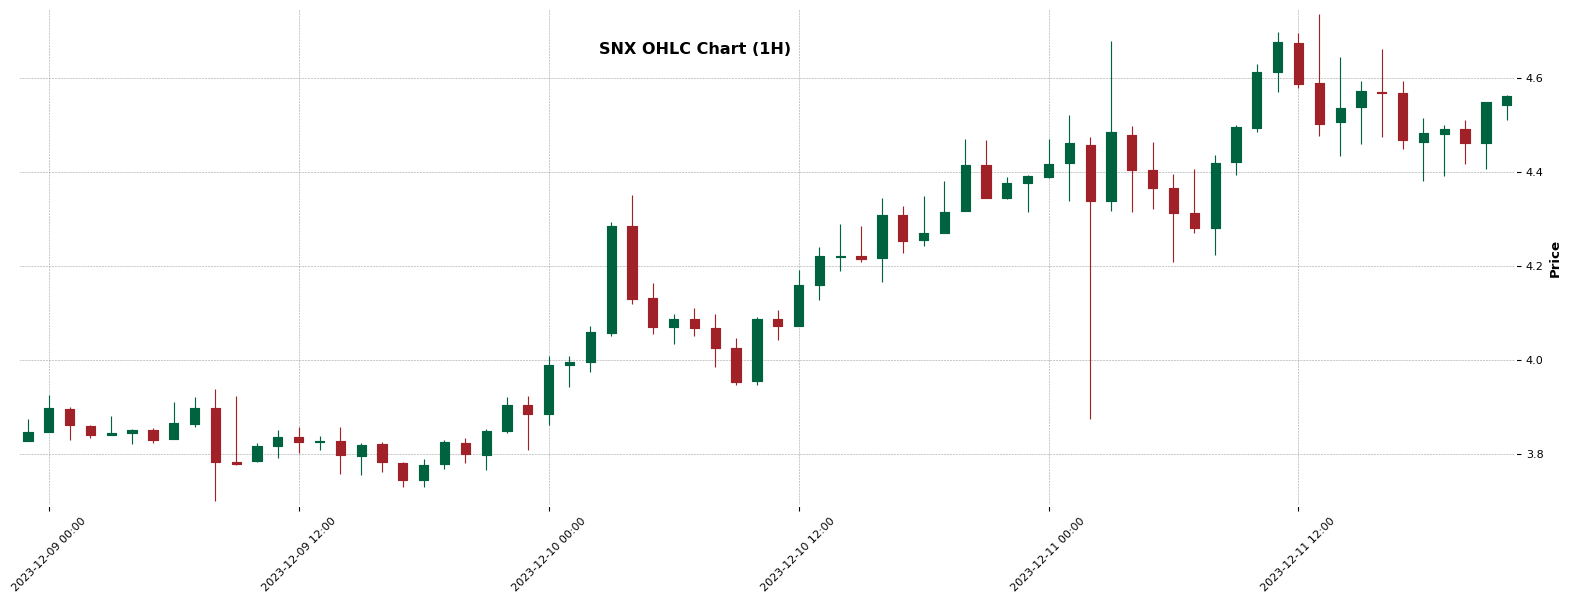
SNX – Double Top identified (1H)
Chart Pattern Information
A potential bearish ‘Double Top’ pattern is currently being formed on the hourly chart for SNX. The pattern started developing at 02:00 on December 11th, 2023 with a starting price of 4.208. A crucial pivot point was experienced at 03:00 with the price reaching the apex at 4.678 before declining again. Further developments saw the pattern’s secondary pivot form at 13:00 with a price point of 4.735. As of 18:00, the pattern is incomplete with an end price of 4.208. Investors should watch the chart closely for completion with a potential profiting opportunity at 3.681. Please note the stop loss at 4.7877.
About SNX
Synthetix (SNX) is a cryptocurrency and operates on the Ethereum platform. Synthetix has a current supply of 328,193,104.0887736 with 300,313,249.31032515 in circulation. The last known price of Synthetix is 4.5154 USD and is up 3.25 over the last 24 hours. It is currently trading on 529 active market(s) with $249,823,056.92 traded over the last 24 hours. More information can be found at https://www.synthetix.io/.
Crypto Chart Pattern Alerts — 11th December 2023 (AVAX, BNB, ALGO, and many more)
Crypto Chart Pattern Alerts, 9th December 2023
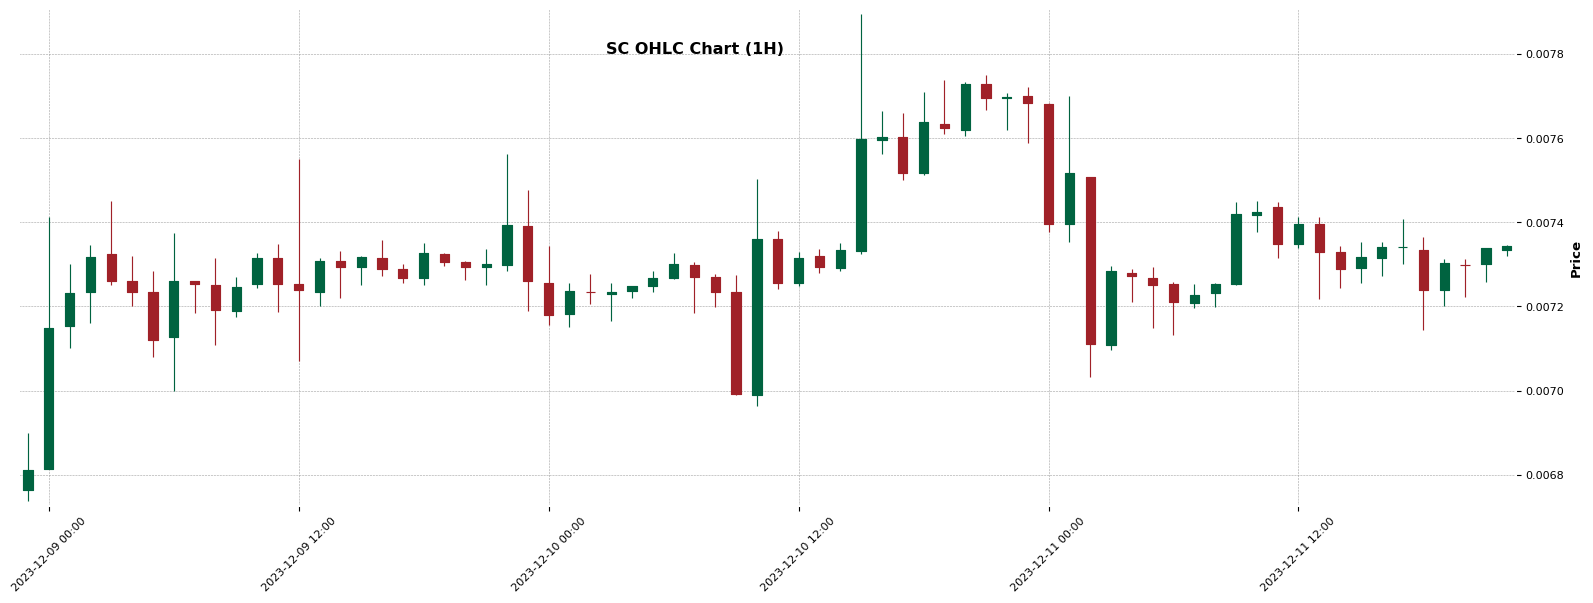
SC – Double Top identified (1H)
Chart Pattern Information
Currently, a ‘Double Top’ pattern is in the process of forming on the SC hourly chart, indicating a likely bearish trend. As of 22:00 on December 9, 2023, the apex price reached 0.007561, followed by a dip to 0.006964 by 10:00 on December 10, 2023. By 15:00 the same day, it rallied to a high of 0.007894. The pattern remains incomplete with an anticipation of drop to the initial price of 0.006964 by 18:00 on December 11, 2023. Employing this signal, traders can set the stoploss at 0.007987 and potential profit target at 0.006034.
About SC
Siacoin (SC) is a cryptocurrency . Users are able to generate SC through the process of mining. Siacoin has a current supply of 55,930,695,000 with 55,906,739,437.68671 in circulation. The last known price of Siacoin is 0.0073 USD and is down -4.83 over the last 24 hours. It is currently trading on 90 active market(s) with $20,051,470.57 traded over the last 24 hours. More information can be found at https://sia.tech/.
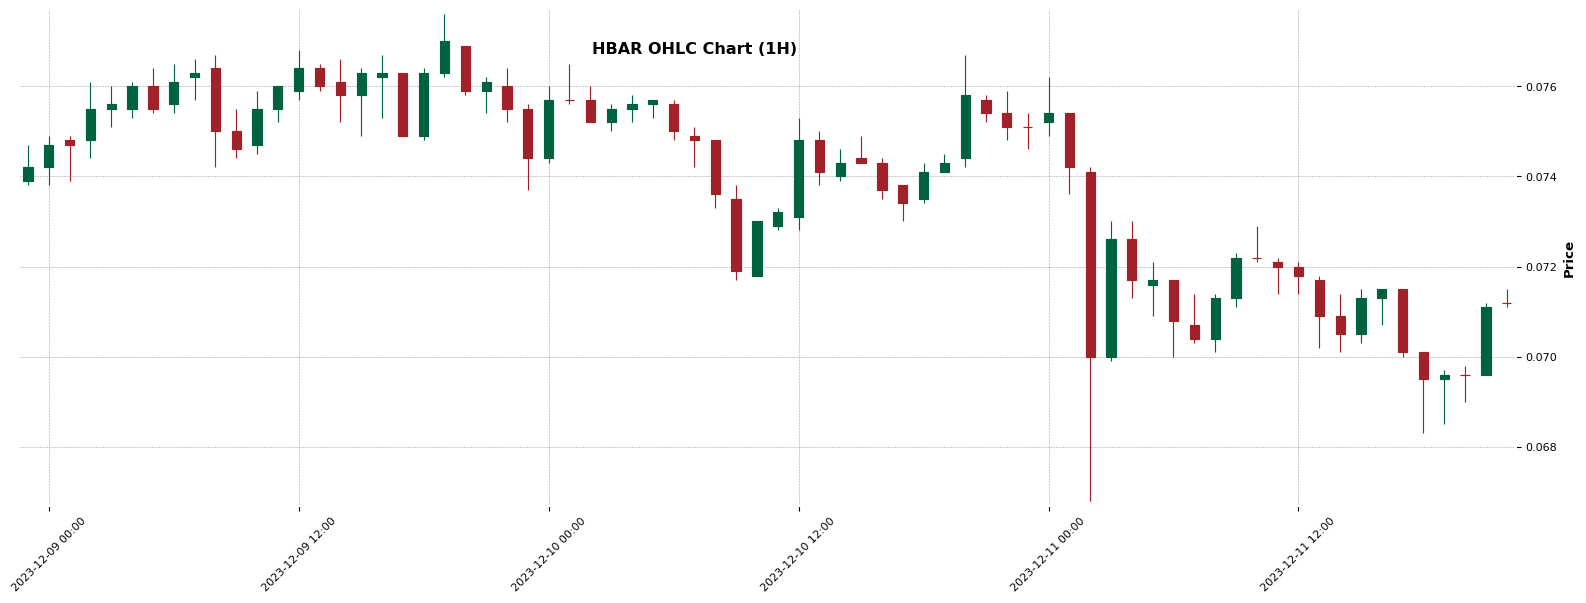
HBAR – Double Bottom identified (1H)
Chart Pattern Information
The hourly chart for HBAR is presently forming a fascinating pattern. A ‘Double Bottom’ pattern, known as a bullish indicator, is currently in the making. This commenced at 04:00 on December 11, 2023, with a price of $0.0729. The price slightly fell to $0.07 by 06:00, then rose to $0.0729 by 10:00, and dropped again to $0.0701 around 14:00. This pattern suggests potential for hitting a profit level of $0.0758, with a stop loss at $0.06971. However, the formation is not complete yet and still developing, thereby remaining unconfirmed. Always consider the risk before trading.
About HBAR
Hedera (HBAR) is a cryptocurrency launched in 2017. Hedera has a current supply of 50,000,000,000 with 33,576,848,010.195717 in circulation. The last known price of Hedera is 0.0712 USD and is down -5.69 over the last 24 hours. It is currently trading on 200 active market(s) with $106,785,185.55 traded over the last 24 hours. More information can be found at https://www.hedera.com/.
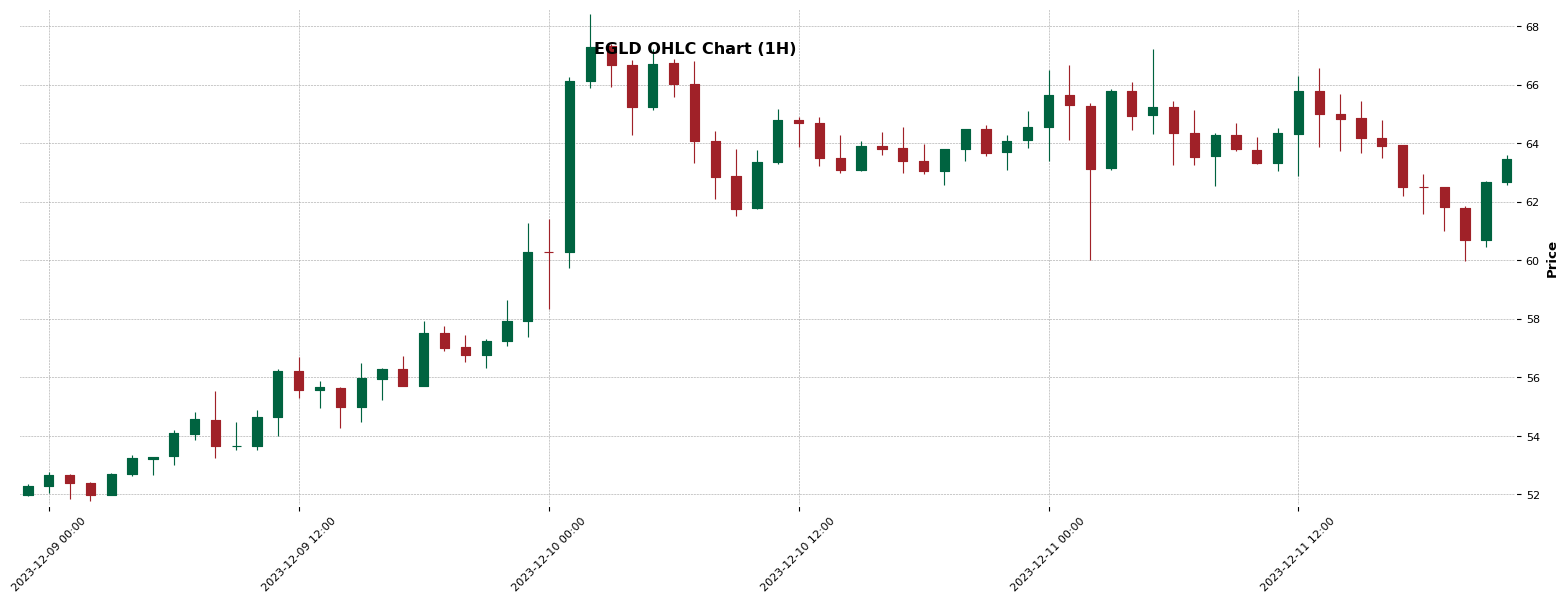
EGLD – Triangle identified (1H)
Chart Pattern Information
EGLD is currently exhibiting a potentially developing Triangle pattern on the hourly chart. The formation began on Dec 9, 2023, at 21:00 with the price at 56.31 and briefly peaked at 68.41 on Dec 10 at 02:00. A dip to 60 followed on Dec 11 at 02:00 before a moderate recovery to 67.21 on the same day at 05:00. The pattern, still in process, indicates a possible intersect at 65.44 on Dec 12, 2023, at 19:00. Despite the pattern’s maturity, it’s critical to note that its type remains unknown, and completion status is still incomplete.
About EGLD
MultiversX (EGLD) is a cryptocurrency . MultiversX has a current supply of 26,320,124 with 26,314,972 in circulation. The last known price of MultiversX is 63.26 USD and is down -0.44 over the last 24 hours. It is currently trading on 205 active market(s) with $302,980,835.78 traded over the last 24 hours. More information can be found at https://multiversx.com/.
ALGO – Triple Bottom identified (1H)
Chart Pattern Information
The ALGO hourly chart is currently showing signs of a forming ‘Triple Bottom’ pattern – a bullish indicator. The pattern started forming on December 9, 2023, with an initial price of 0.205, followed by subsequent lows and highs until 02:00 on December 11, 2023, where it posted a price of 0.167. However, it’s important to note that the pattern is still incomplete, indicating potential upward movement to 0.2426. In the event of a reversal, the stop-loss is set at 0.1632. Please monitor this formation closely as it could lead to profitable trading opportunities.
About ALGO
Algorand (ALGO) is a cryptocurrency . Algorand has a current supply of 8,006,619,382.787907. The last known price of Algorand is 0.197 USD and is down -1.37 over the last 24 hours. It is currently trading on 381 active market(s) with $157,115,465.84 traded over the last 24 hours. More information can be found at http://algorand.foundation.
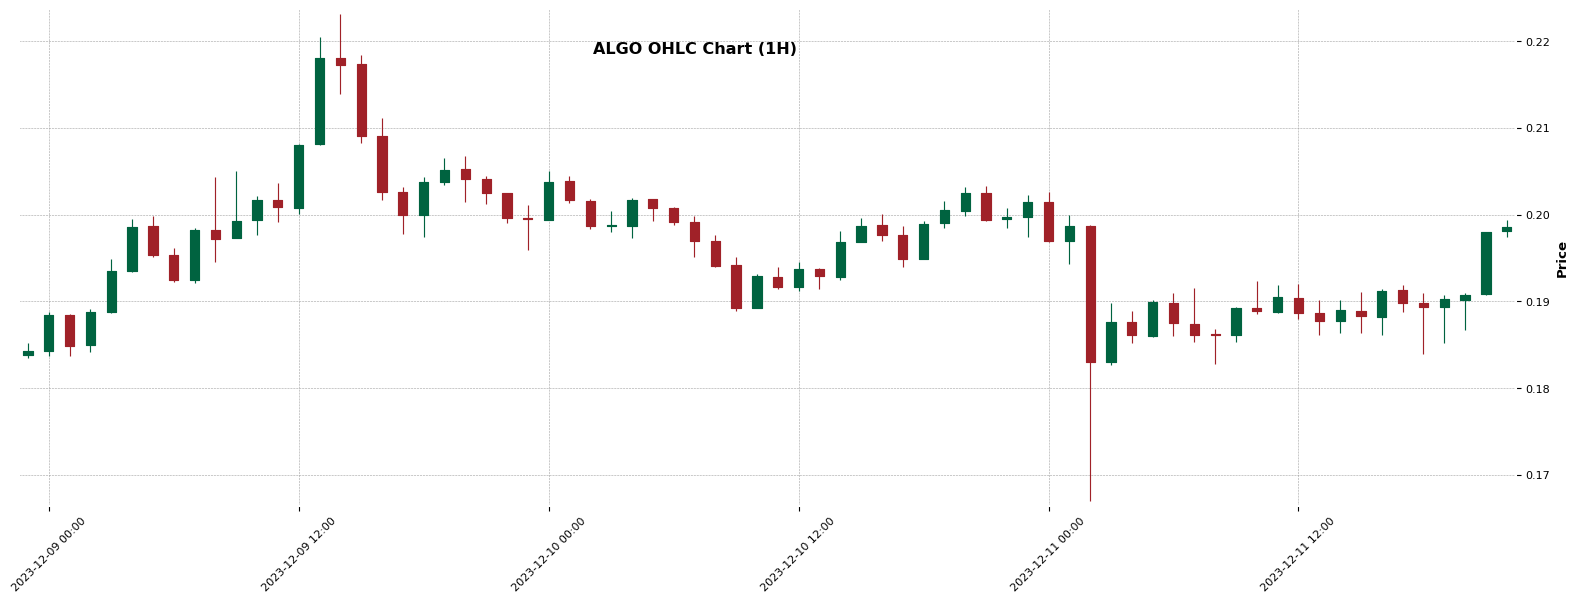
ALGO – Triple Bottom identified (1H)
Chart Pattern Information
Based on the most recent data, a potential bullish ‘Triple Bottom’ chart pattern is currently forming on the ALGO hourly chart. This pattern began forming on December 9, 2023, and appeared to mature by December 11, 2023. The pattern depicts a price movement between $0.1959 to $0.205, eventually settling at an entry point of $0.2029. However, it’s essential to note that this pattern is still in the process of forming and remains incomplete. Potential investors may look out for the profit margin standing at $0.2426, but they should also be aware of the stop-loss point, which is $0.1632.
About ALGO
Algorand (ALGO) is a cryptocurrency . Algorand has a current supply of 8,006,619,382.787907. The last known price of Algorand is 0.1971 USD and is down -1.37 over the last 24 hours. It is currently trading on 381 active market(s) with $157,115,465.84 traded over the last 24 hours. More information can be found at http://algorand.foundation.

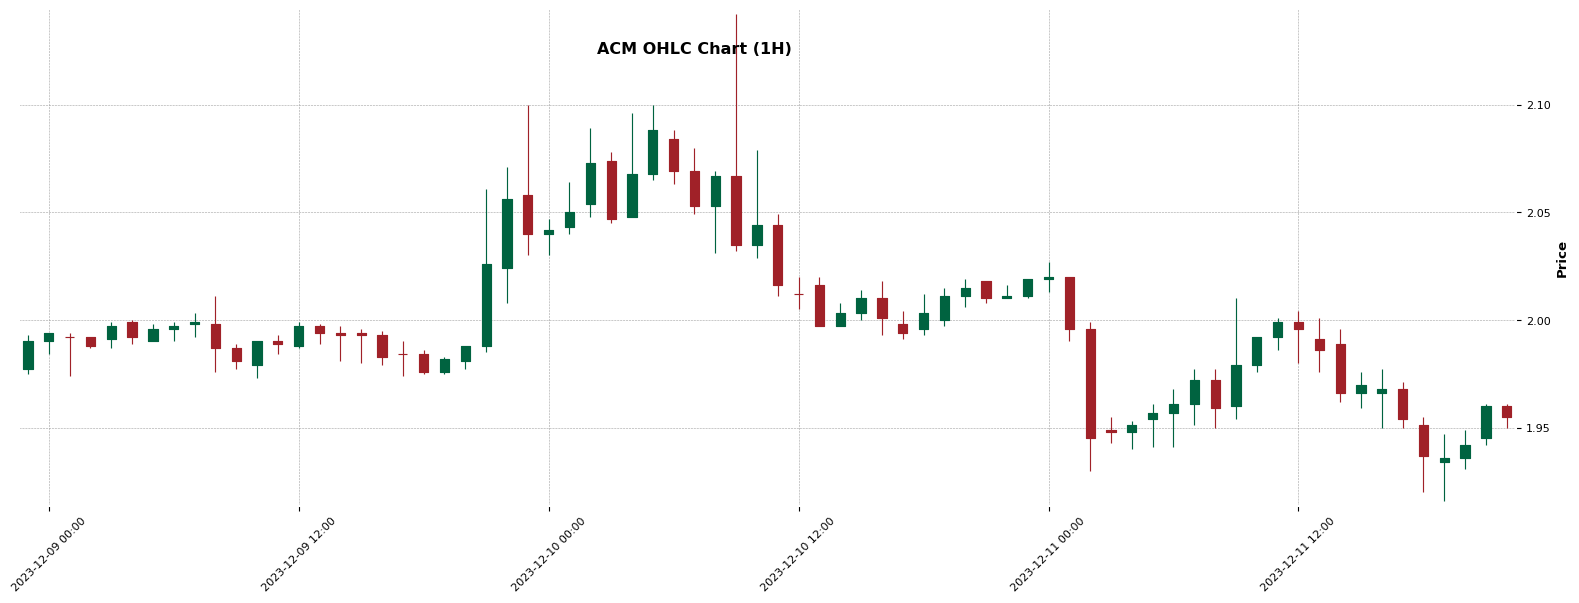
ACM – Wedge identified (1H)
Chart Pattern Information
Currently, Advanced Charting Methods (ACM) is indicating a potentially forming chart pattern called ‘Wedge’ on the hourly chart. The pattern started emerging from a price of 2.142 at 09:00 on December 10, 2023, slumped to 1.997 at 13:00 the same day, recovered slightly to 2.027 around midnight and dipped to 1.93 at 02:00 on December 11, 2023. The intersection price is forecasted at 1.762 around 09:00 on December 12, 2023. This pattern remains incomplete and its type is unknown. Further developments are awaited to determine a potential entry or stop loss point.
About ACM
AC Milan Fan Token (ACM) is a cryptocurrency and operates on the Chiliz platform. AC Milan Fan Token has a current supply of 20,000,000 with 6,027,896 in circulation. The last known price of AC Milan Fan Token is 1.947 USD and is down -3.15 over the last 24 hours. It is currently trading on 36 active market(s) with $1,858,601.52 traded over the last 24 hours. More information can be found at https://www.socios.com/.
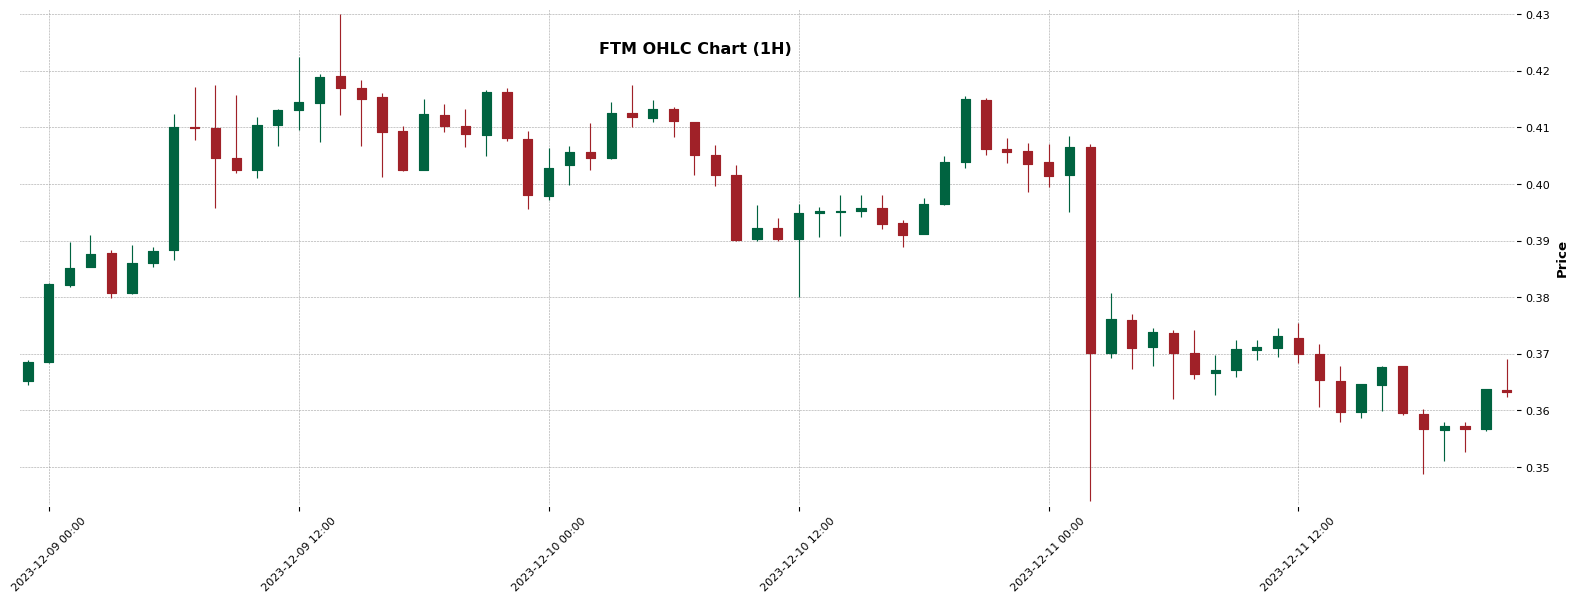
FTM – Triple Bottom identified (1H)
Chart Pattern Information
An interesting pattern is currently forming on the FTM’s hourly chart as of December 9, 2023. This is a ‘Triple Bottom’ pattern, which is generally considered bullish. The pattern began forming at 18:00 with a start price of 0.4187. Critical points in the pattern include a high at 0.4175 (04:00 on 12/10), a low at 0.38 (12:00 on 12/10), and a subsequent high of 0.4156 (20:00 on 12/10). The current entry point stands at 0.415, while the stop loss is set at 0.3366. This pattern is still maturing and remains incomplete. Investors are advised to keep a close watch for potential profitable exits.
About FTM
Fantom (FTM) is a cryptocurrency launched in 2018. Fantom has a current supply of 3,175,000,000 with 2,803,634,835.5265927 in circulation. The last known price of Fantom is 0.3630 USD and is down -10.88 over the last 24 hours. It is currently trading on 555 active market(s) with $141,245,143.12 traded over the last 24 hours. More information can be found at https://fantom.foundation/.
For more chart patterns, trading signals, and crypto data, download our app in the Appstore or Playstore: Download Now